
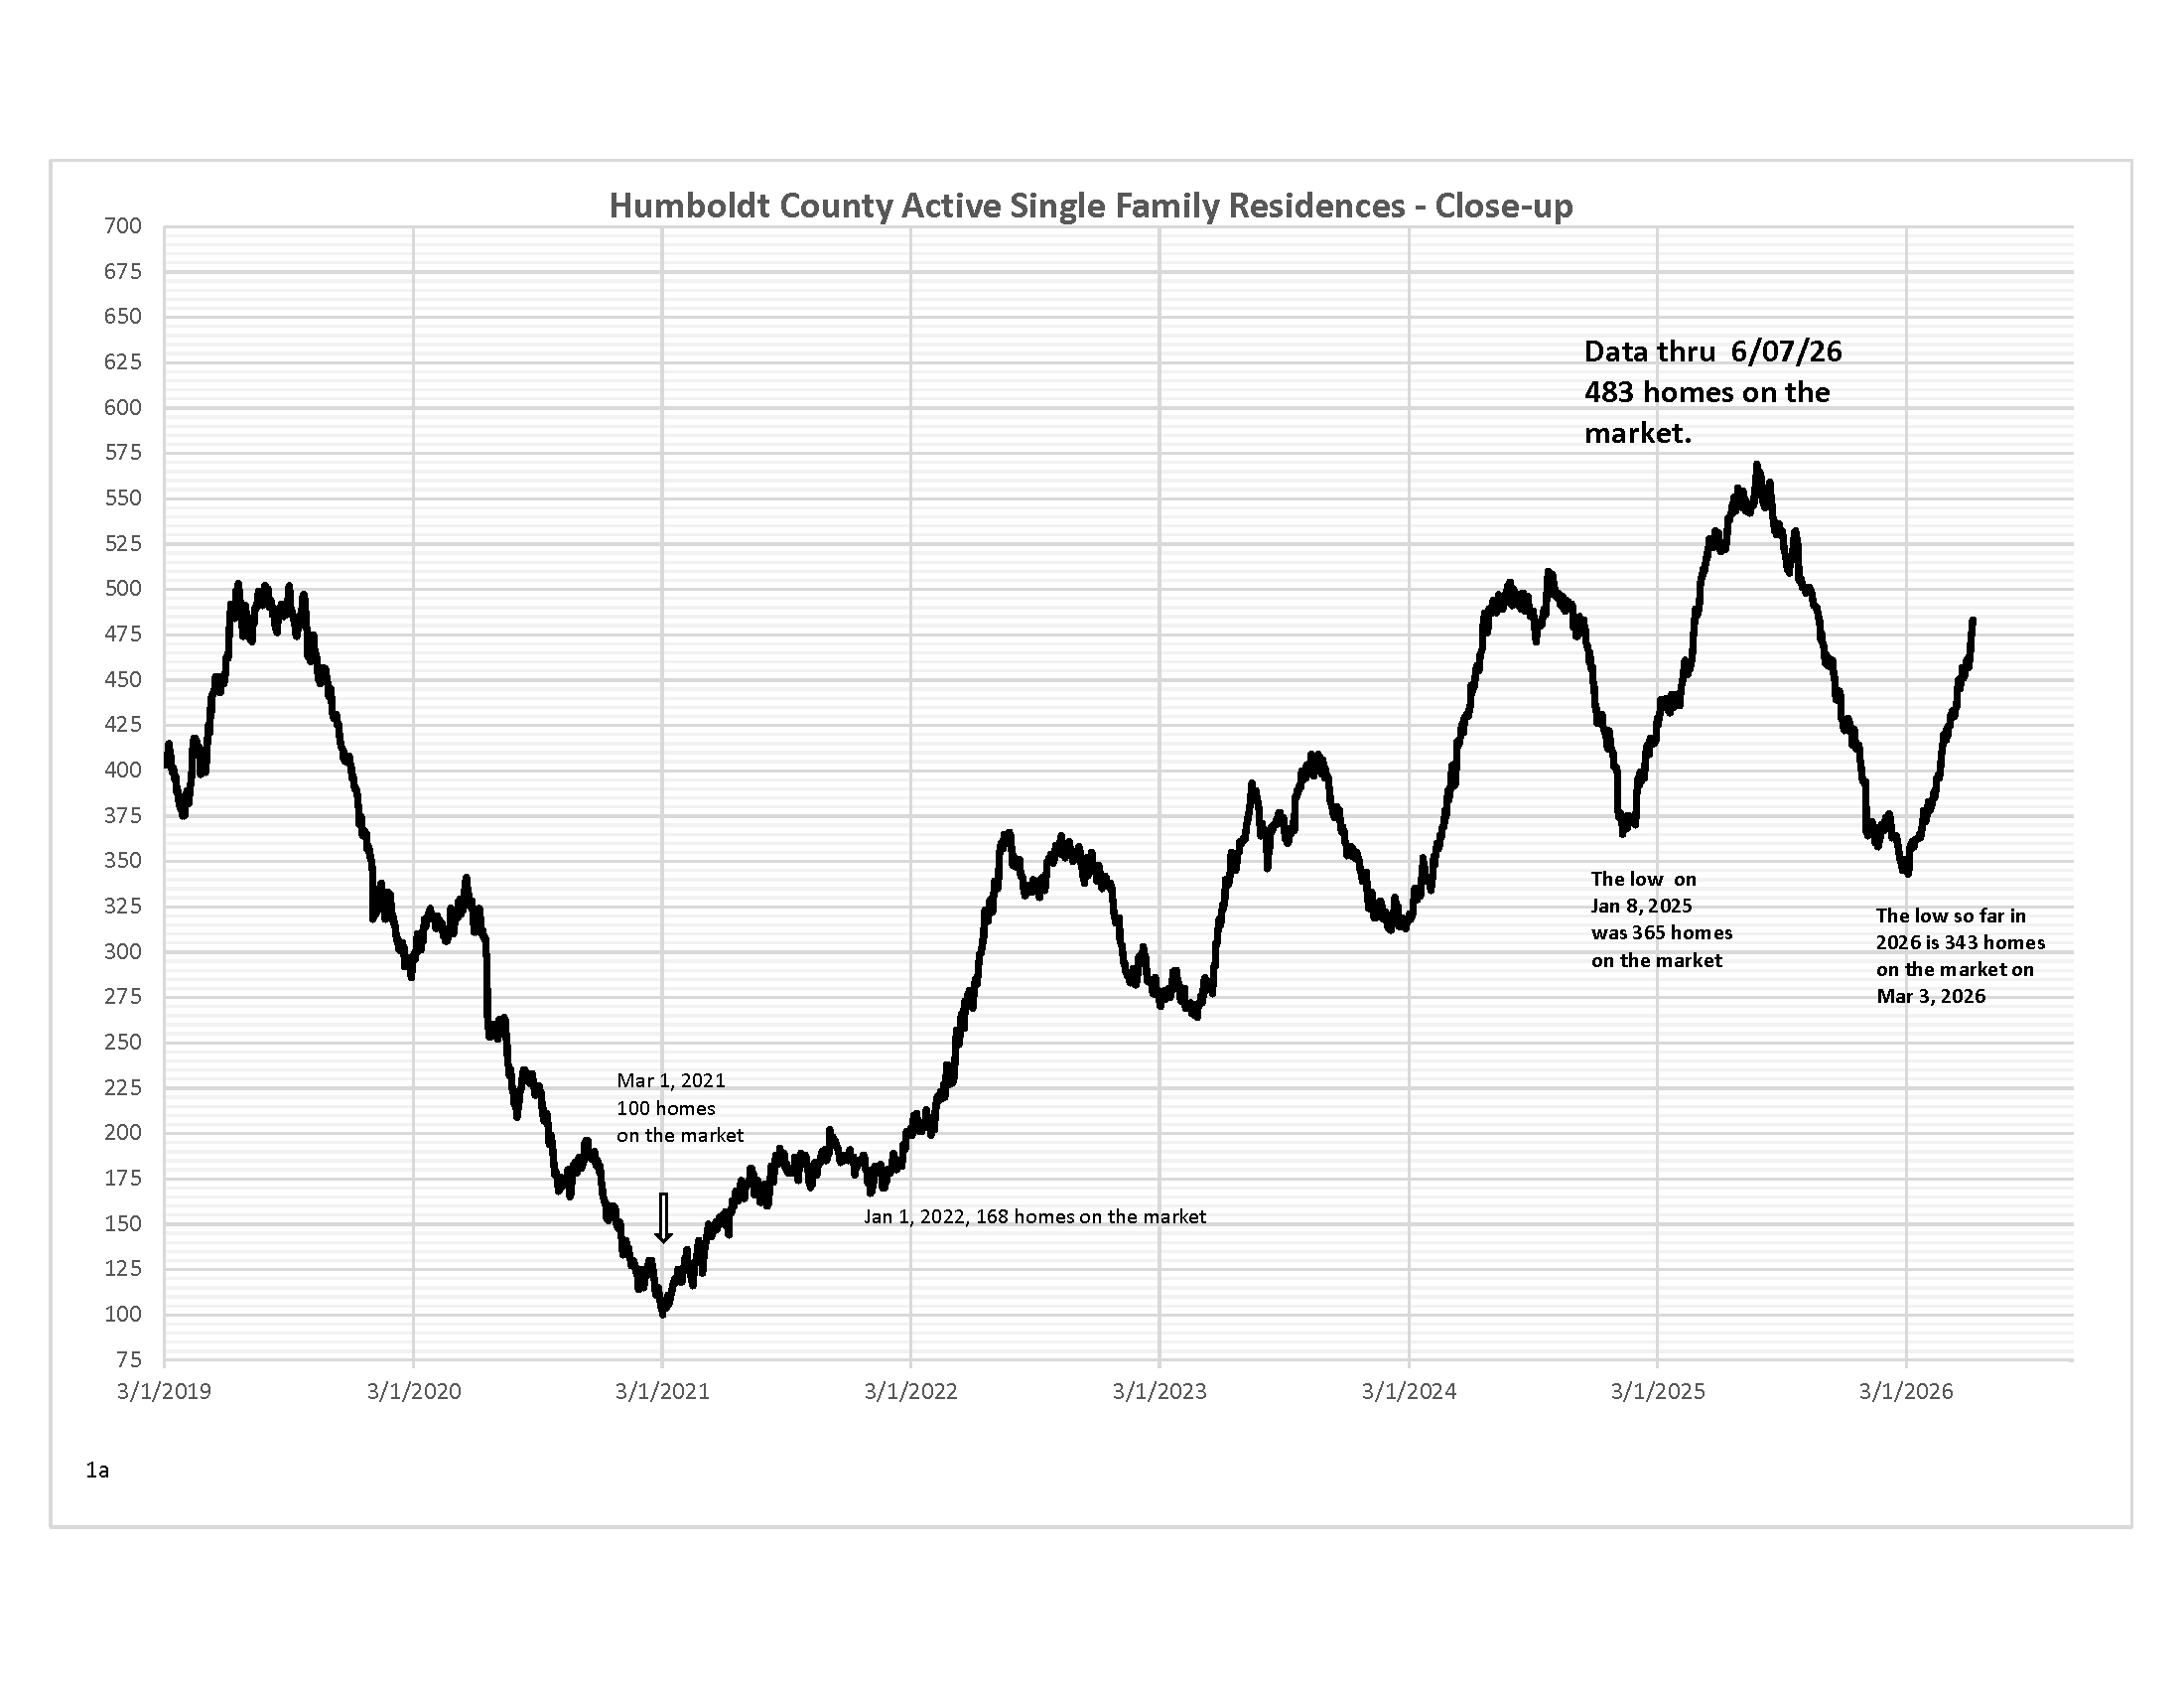
Active Residences (Current Inventory)
Active residences (current inventory) – Inventory increased from 432 homes on the market on May 7, 2026, to 483 on June 7, 2026. There are fewer homes available than on this date last year, when 526 were on the market. We should see inventory continue to increase into July and maybe August.
The monthly charts are updated through May 2026
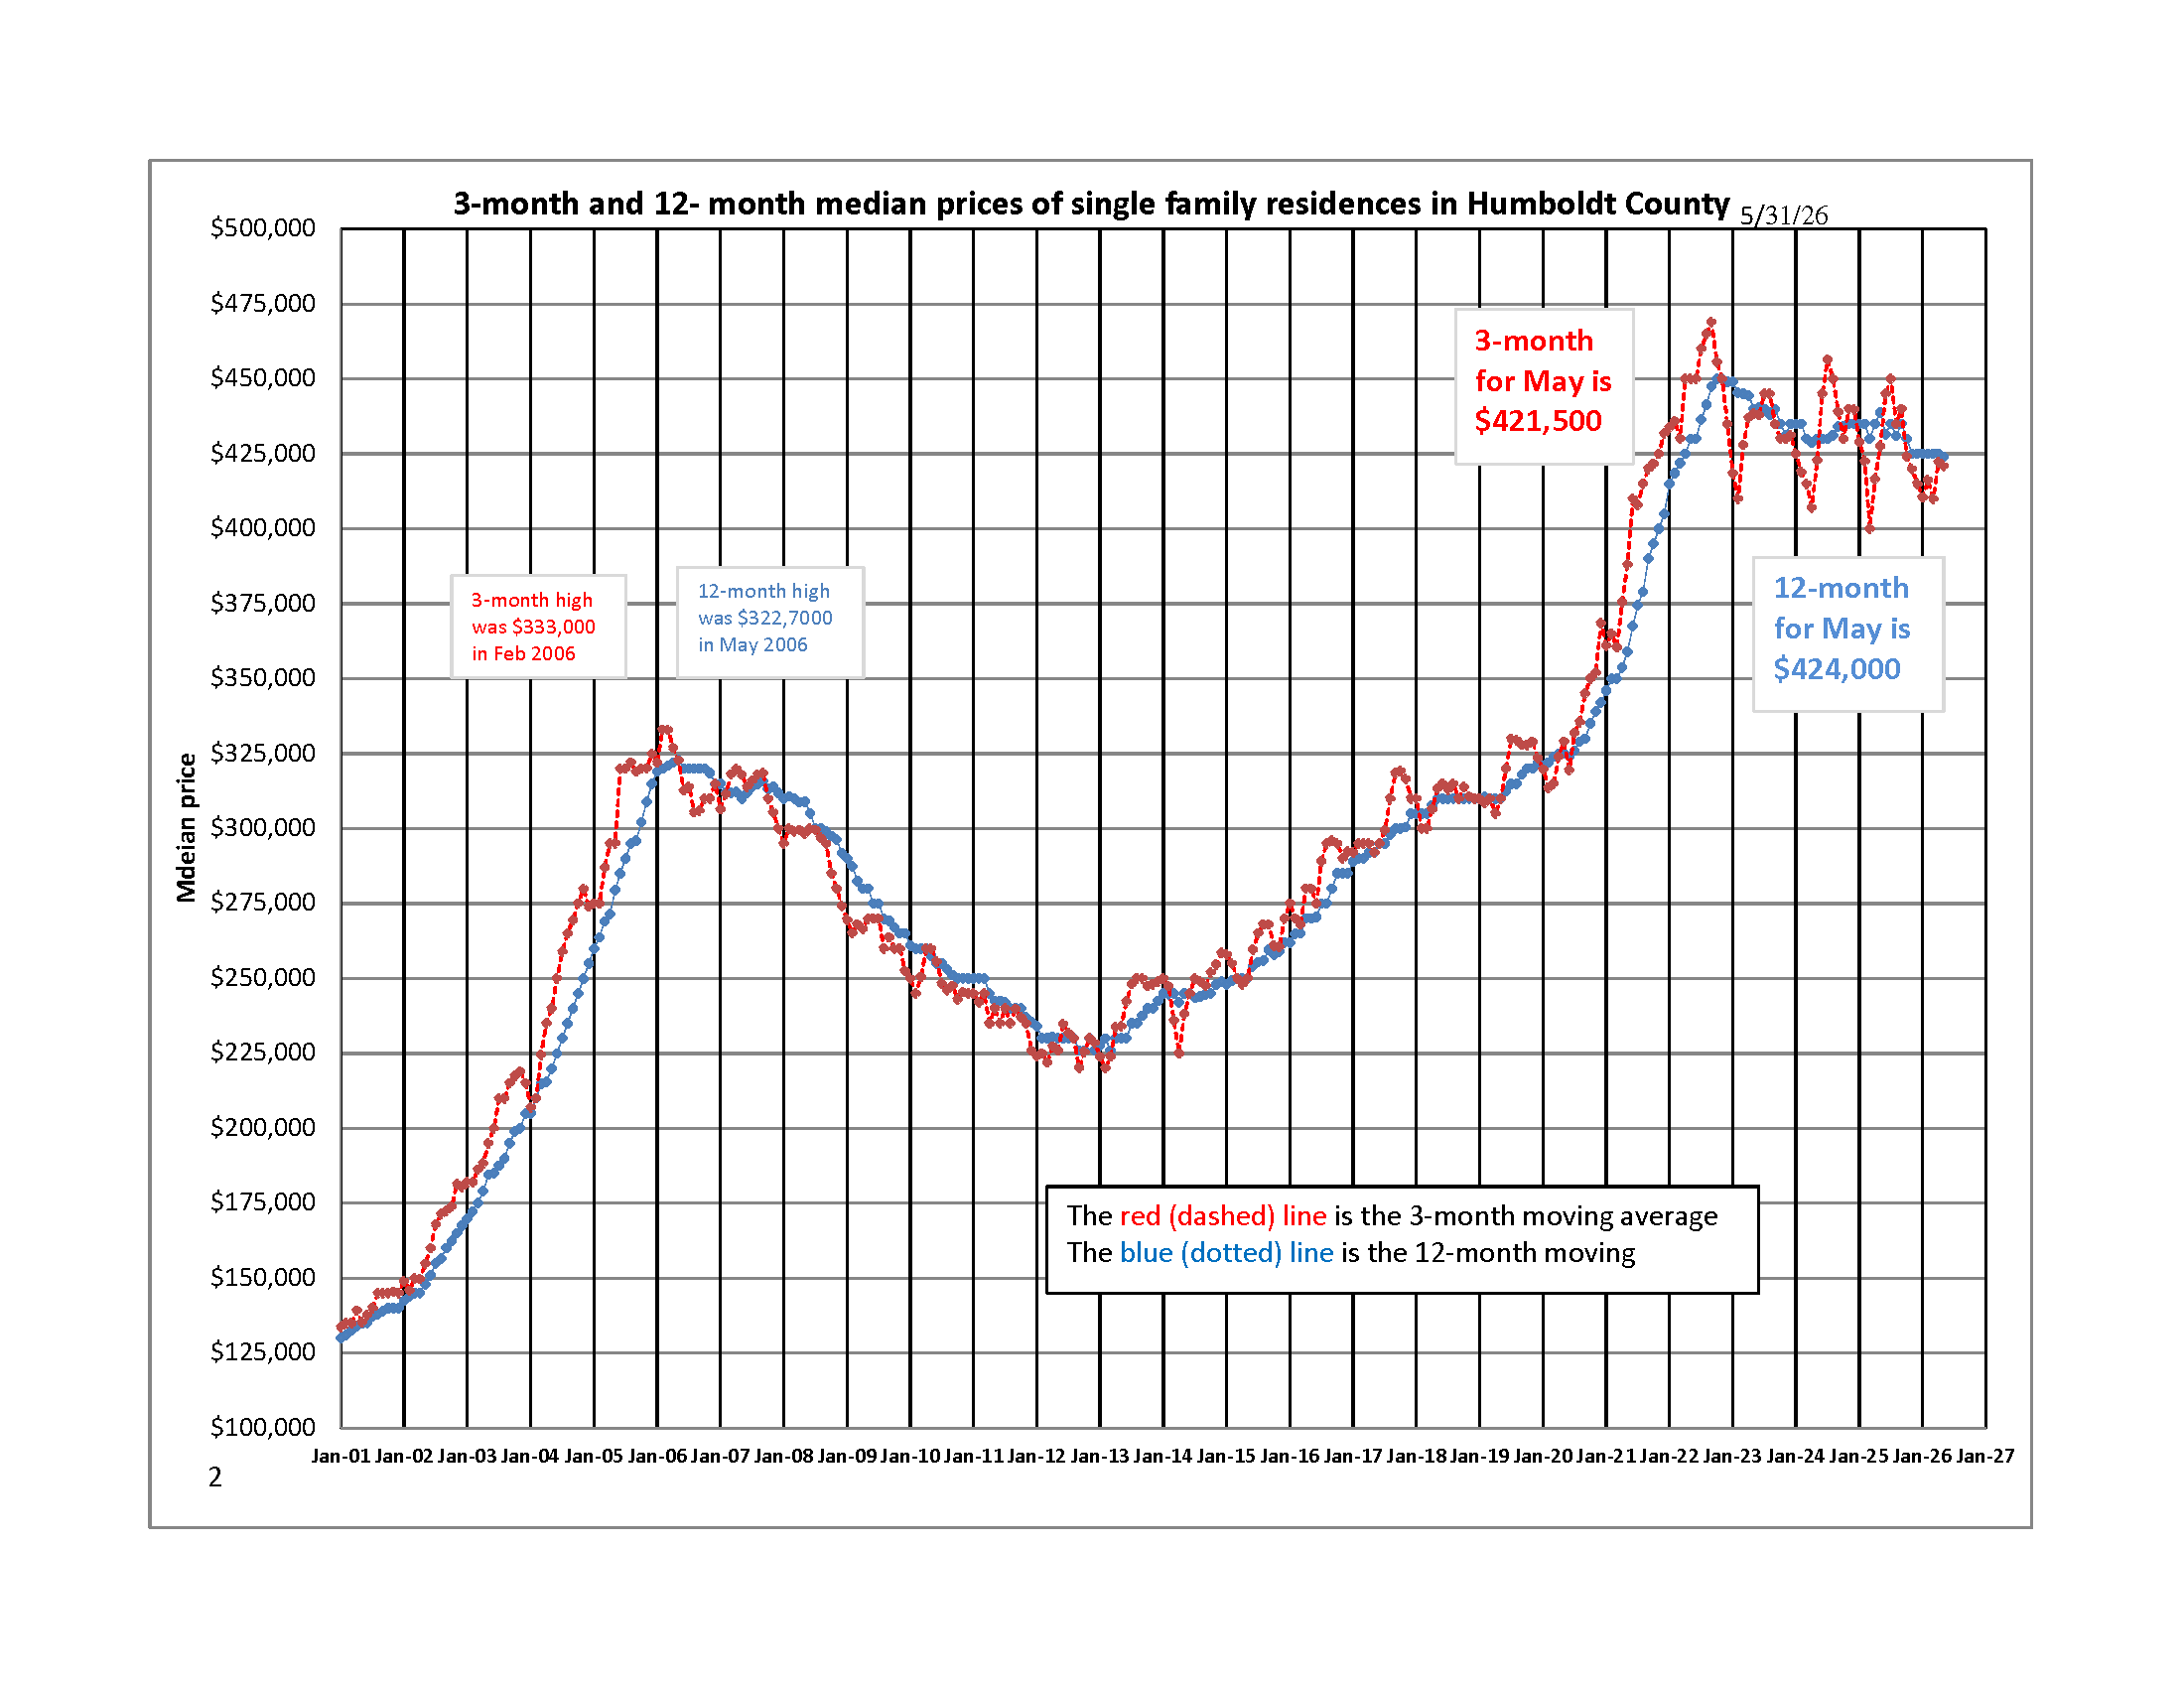
Median Prices
3 & 12-Month Median Prices. There was a modest dip in both the 3-month and 12-month median prices in May. This typically does not happen this late into the buying season. The 3-month median price decreased from $422,500 in April to $421,500 in May, and the 12-month median price, after remaining at $425,000 for six months, decreased to $424,000. Not a large difference, but worth noting when the expected move is to the upside during the buying season.
The monthly charts are updated through February 2026
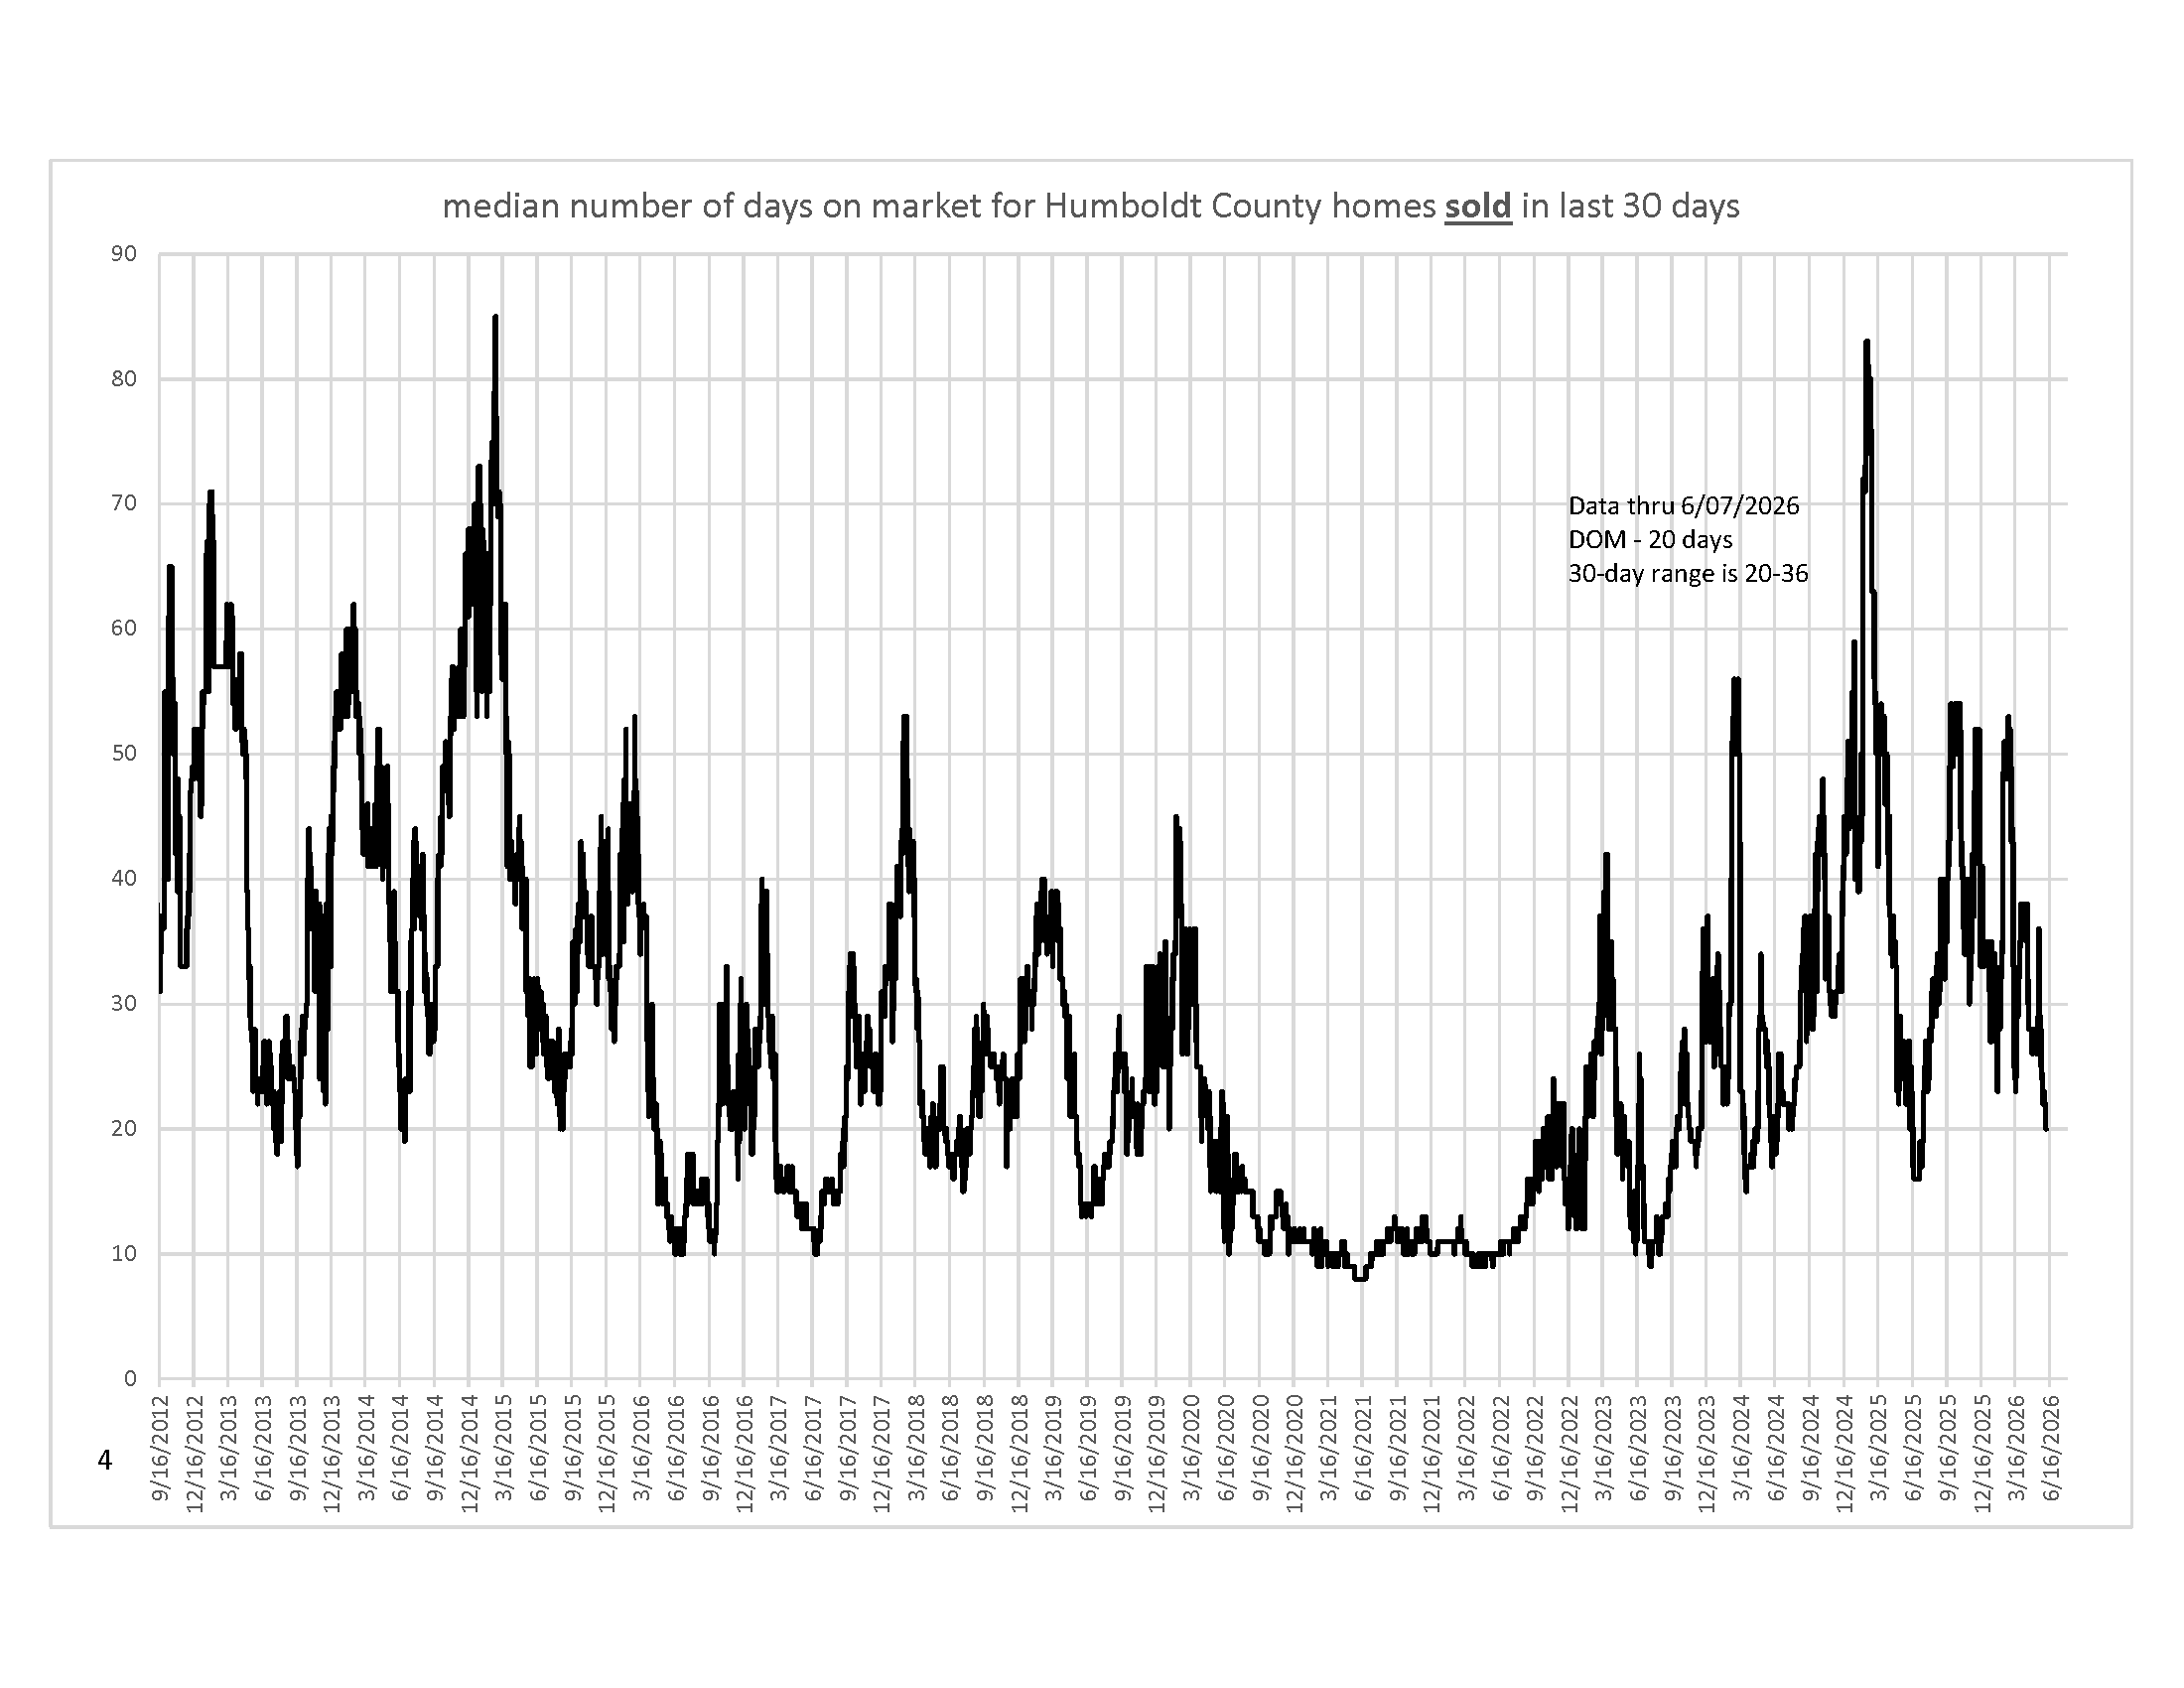
Median Days on Market For homes sold over the past 30 days
Median DOM (days on market - the time it takes for 50% of homes to leave the market for homes that sold over the past 30 days). The median days on the market decreased from 28 on May 8, 2026, to 20 on June 7, 2026. This decrease is normal and expected behavior for this part of our annual cycle. It is, however, at a higher level at this time of the year than the past ten years. Homes are staying on the market a bit longer than they used to.
The monthly charts are updated through May 2026
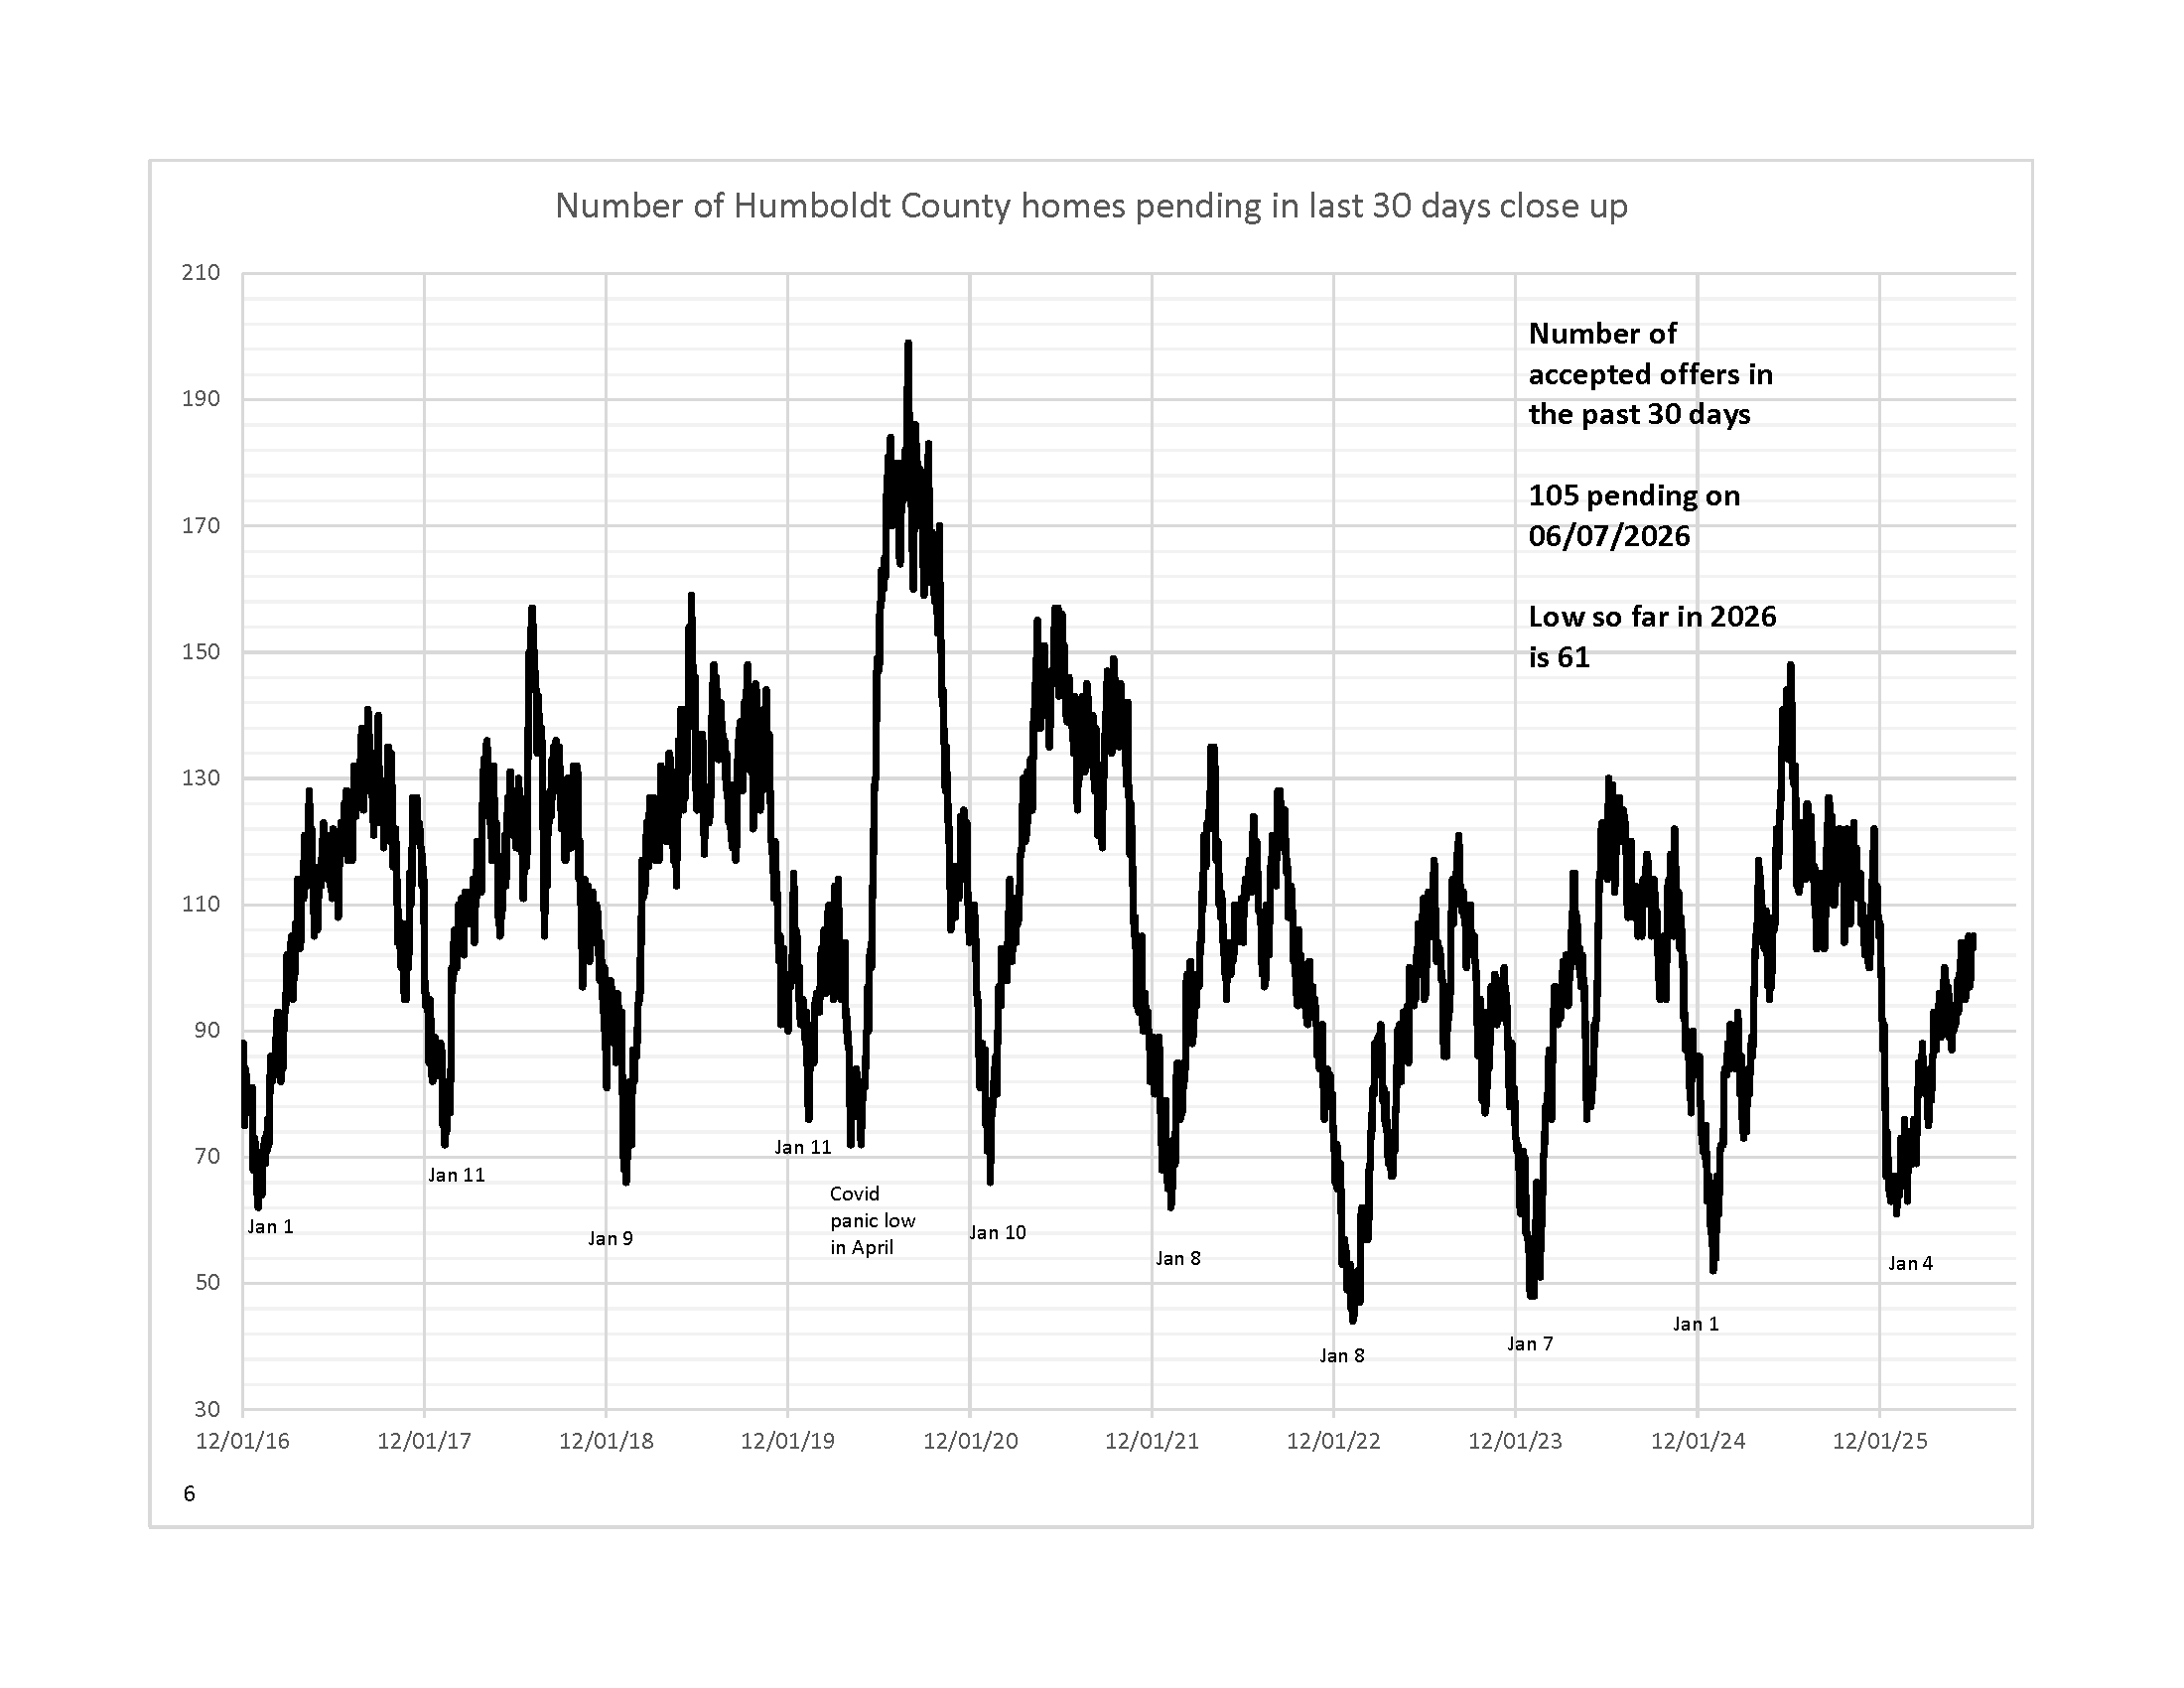
Number of Homes Pending in the Past 30 Days
Number of pendings over the last 30 days, close-up. The number of closed sales so far this year (not shown) is nearly the same as this time last year, but the current pending sales are lower compared to this time last year. This may lead to a lower total number of sales at the end of the year compared to last year. On June 7, 2026, there were 105 homes pending in the past 30 days compared to 148 the year before.
The monthly charts are updated through May 2026
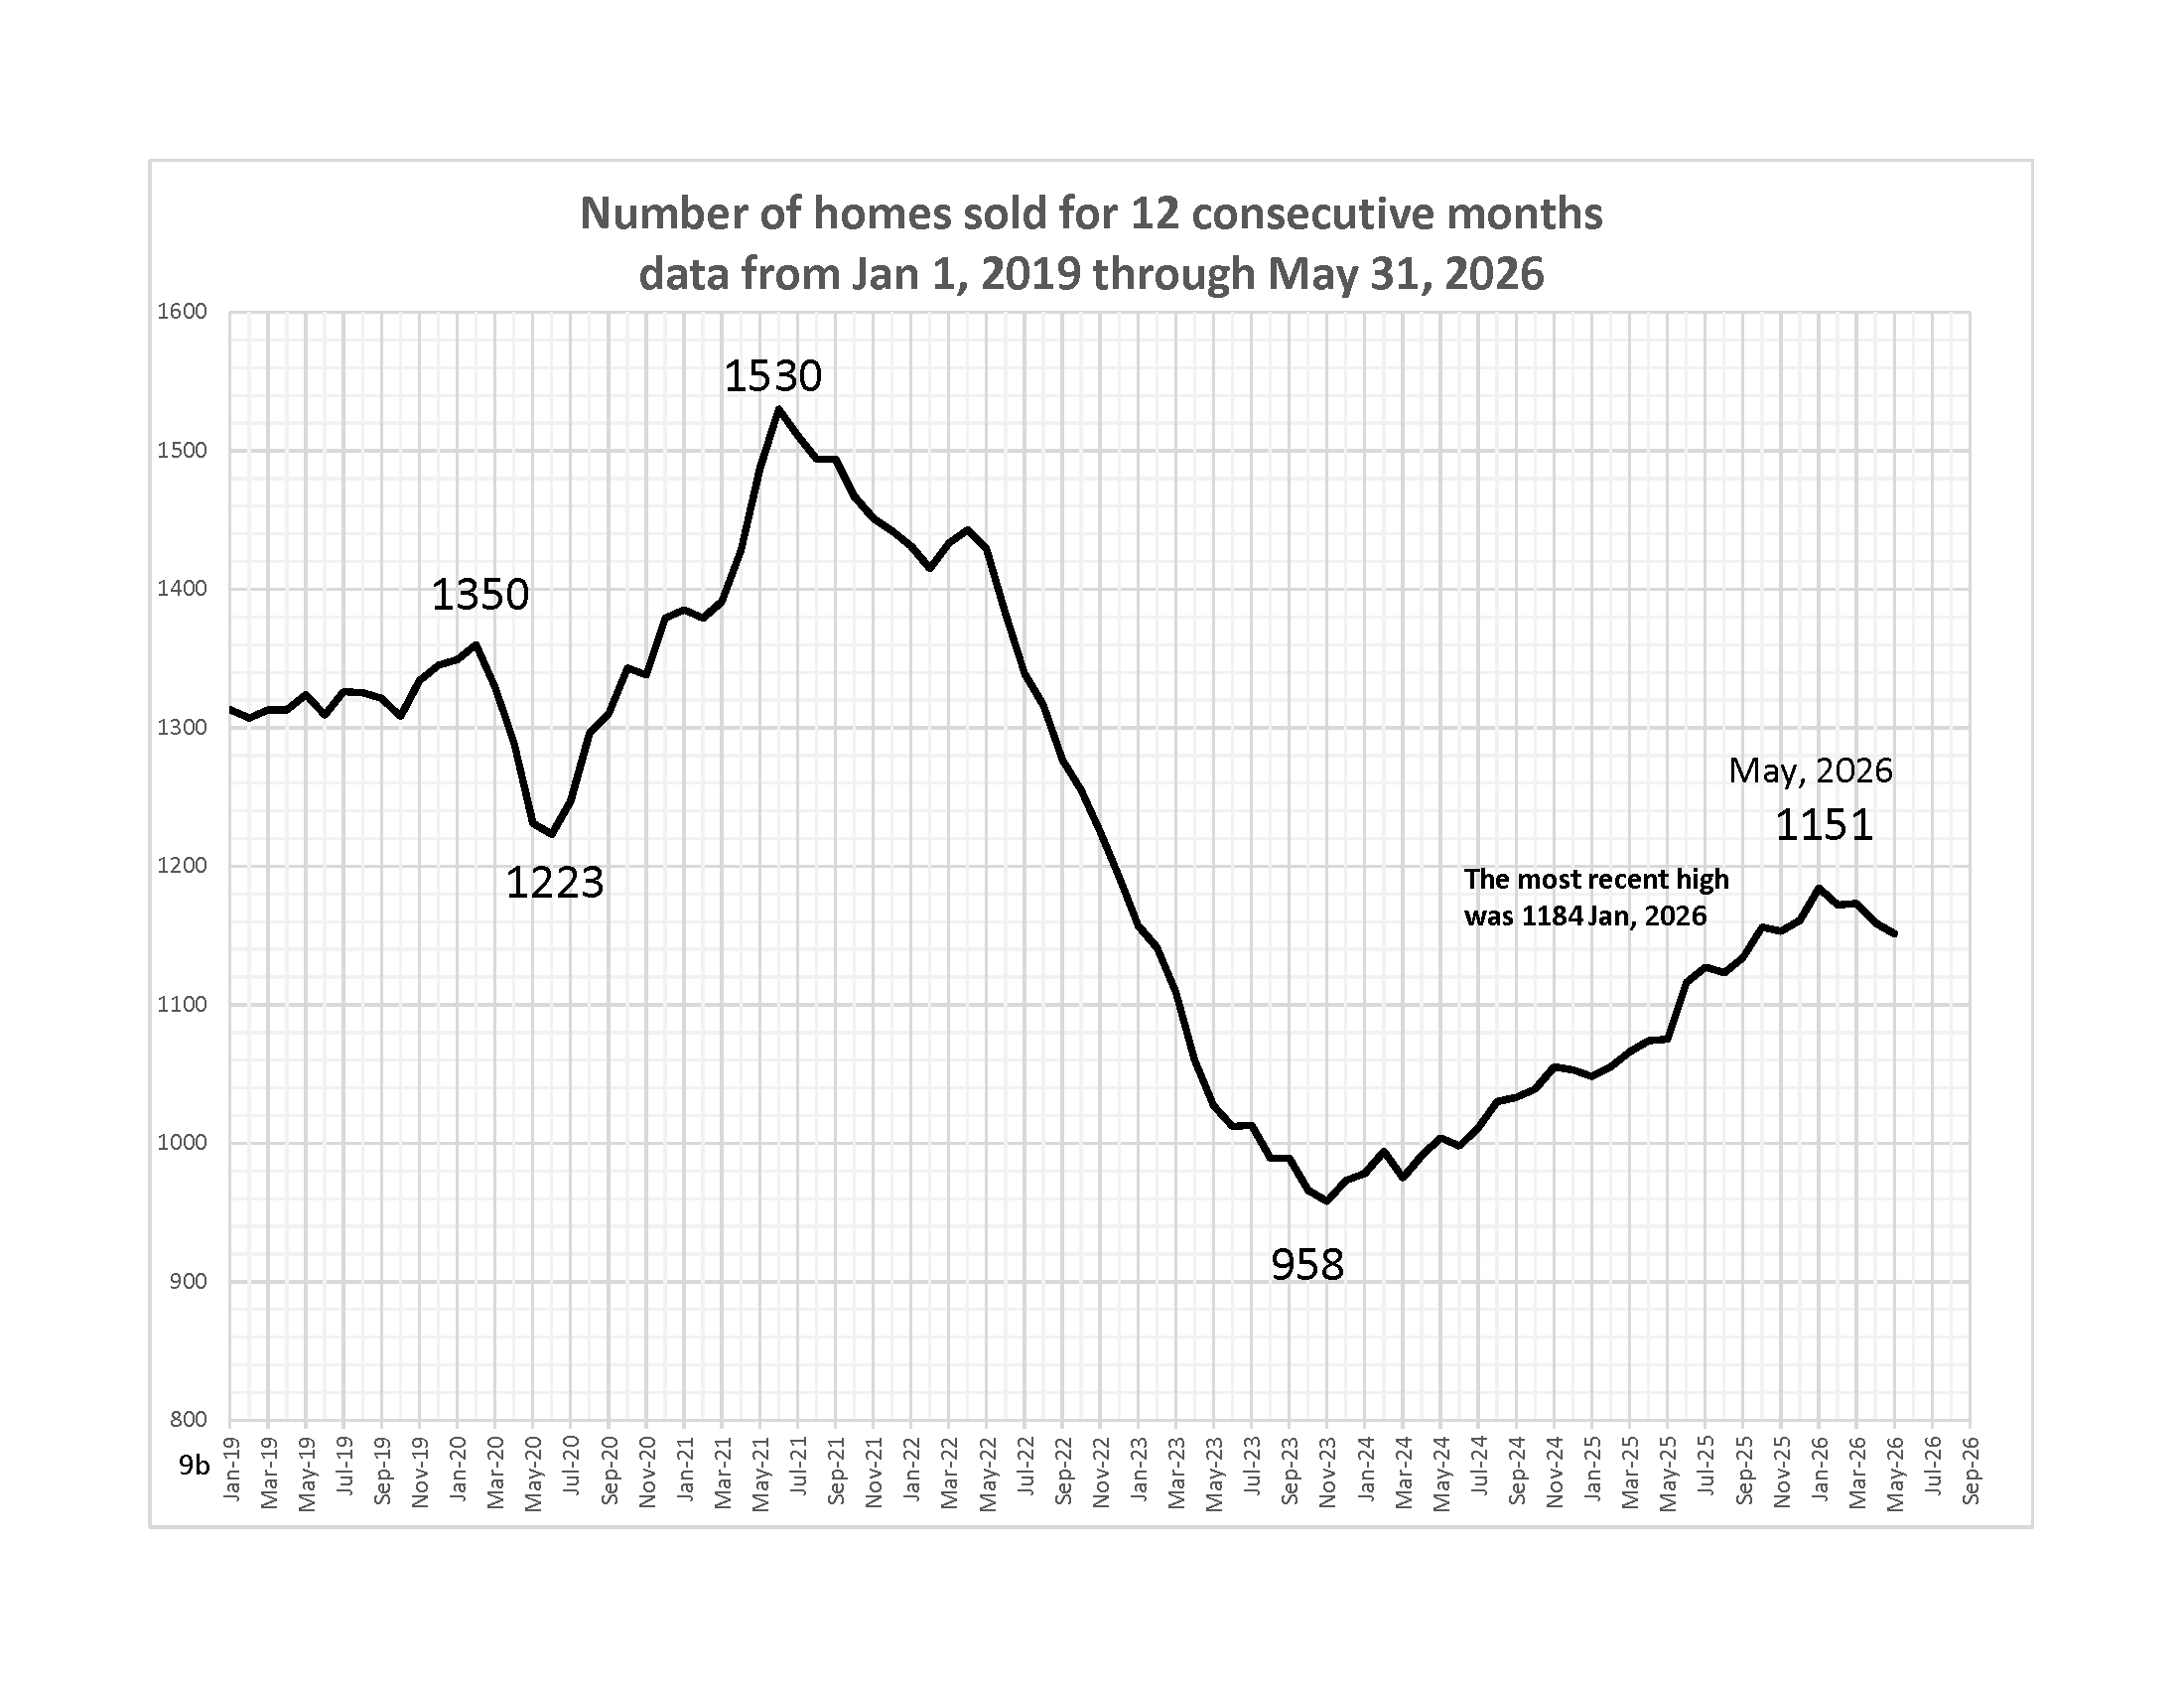
Homes Sold for 12 Consecutive Months
Homes sold for 12 Consecutive Months. Last month, I wrote, “With pending sales a bit weaker than normal this time of the year, this is a trend (down) to keep an eye on”. Sales for 12 consecutive months dipped again in May, down from 1159 in April to 1151. We peaked at 1184 in January, 2028, and have been slowly decreasing since.
The monthly charts are updated through May 2026
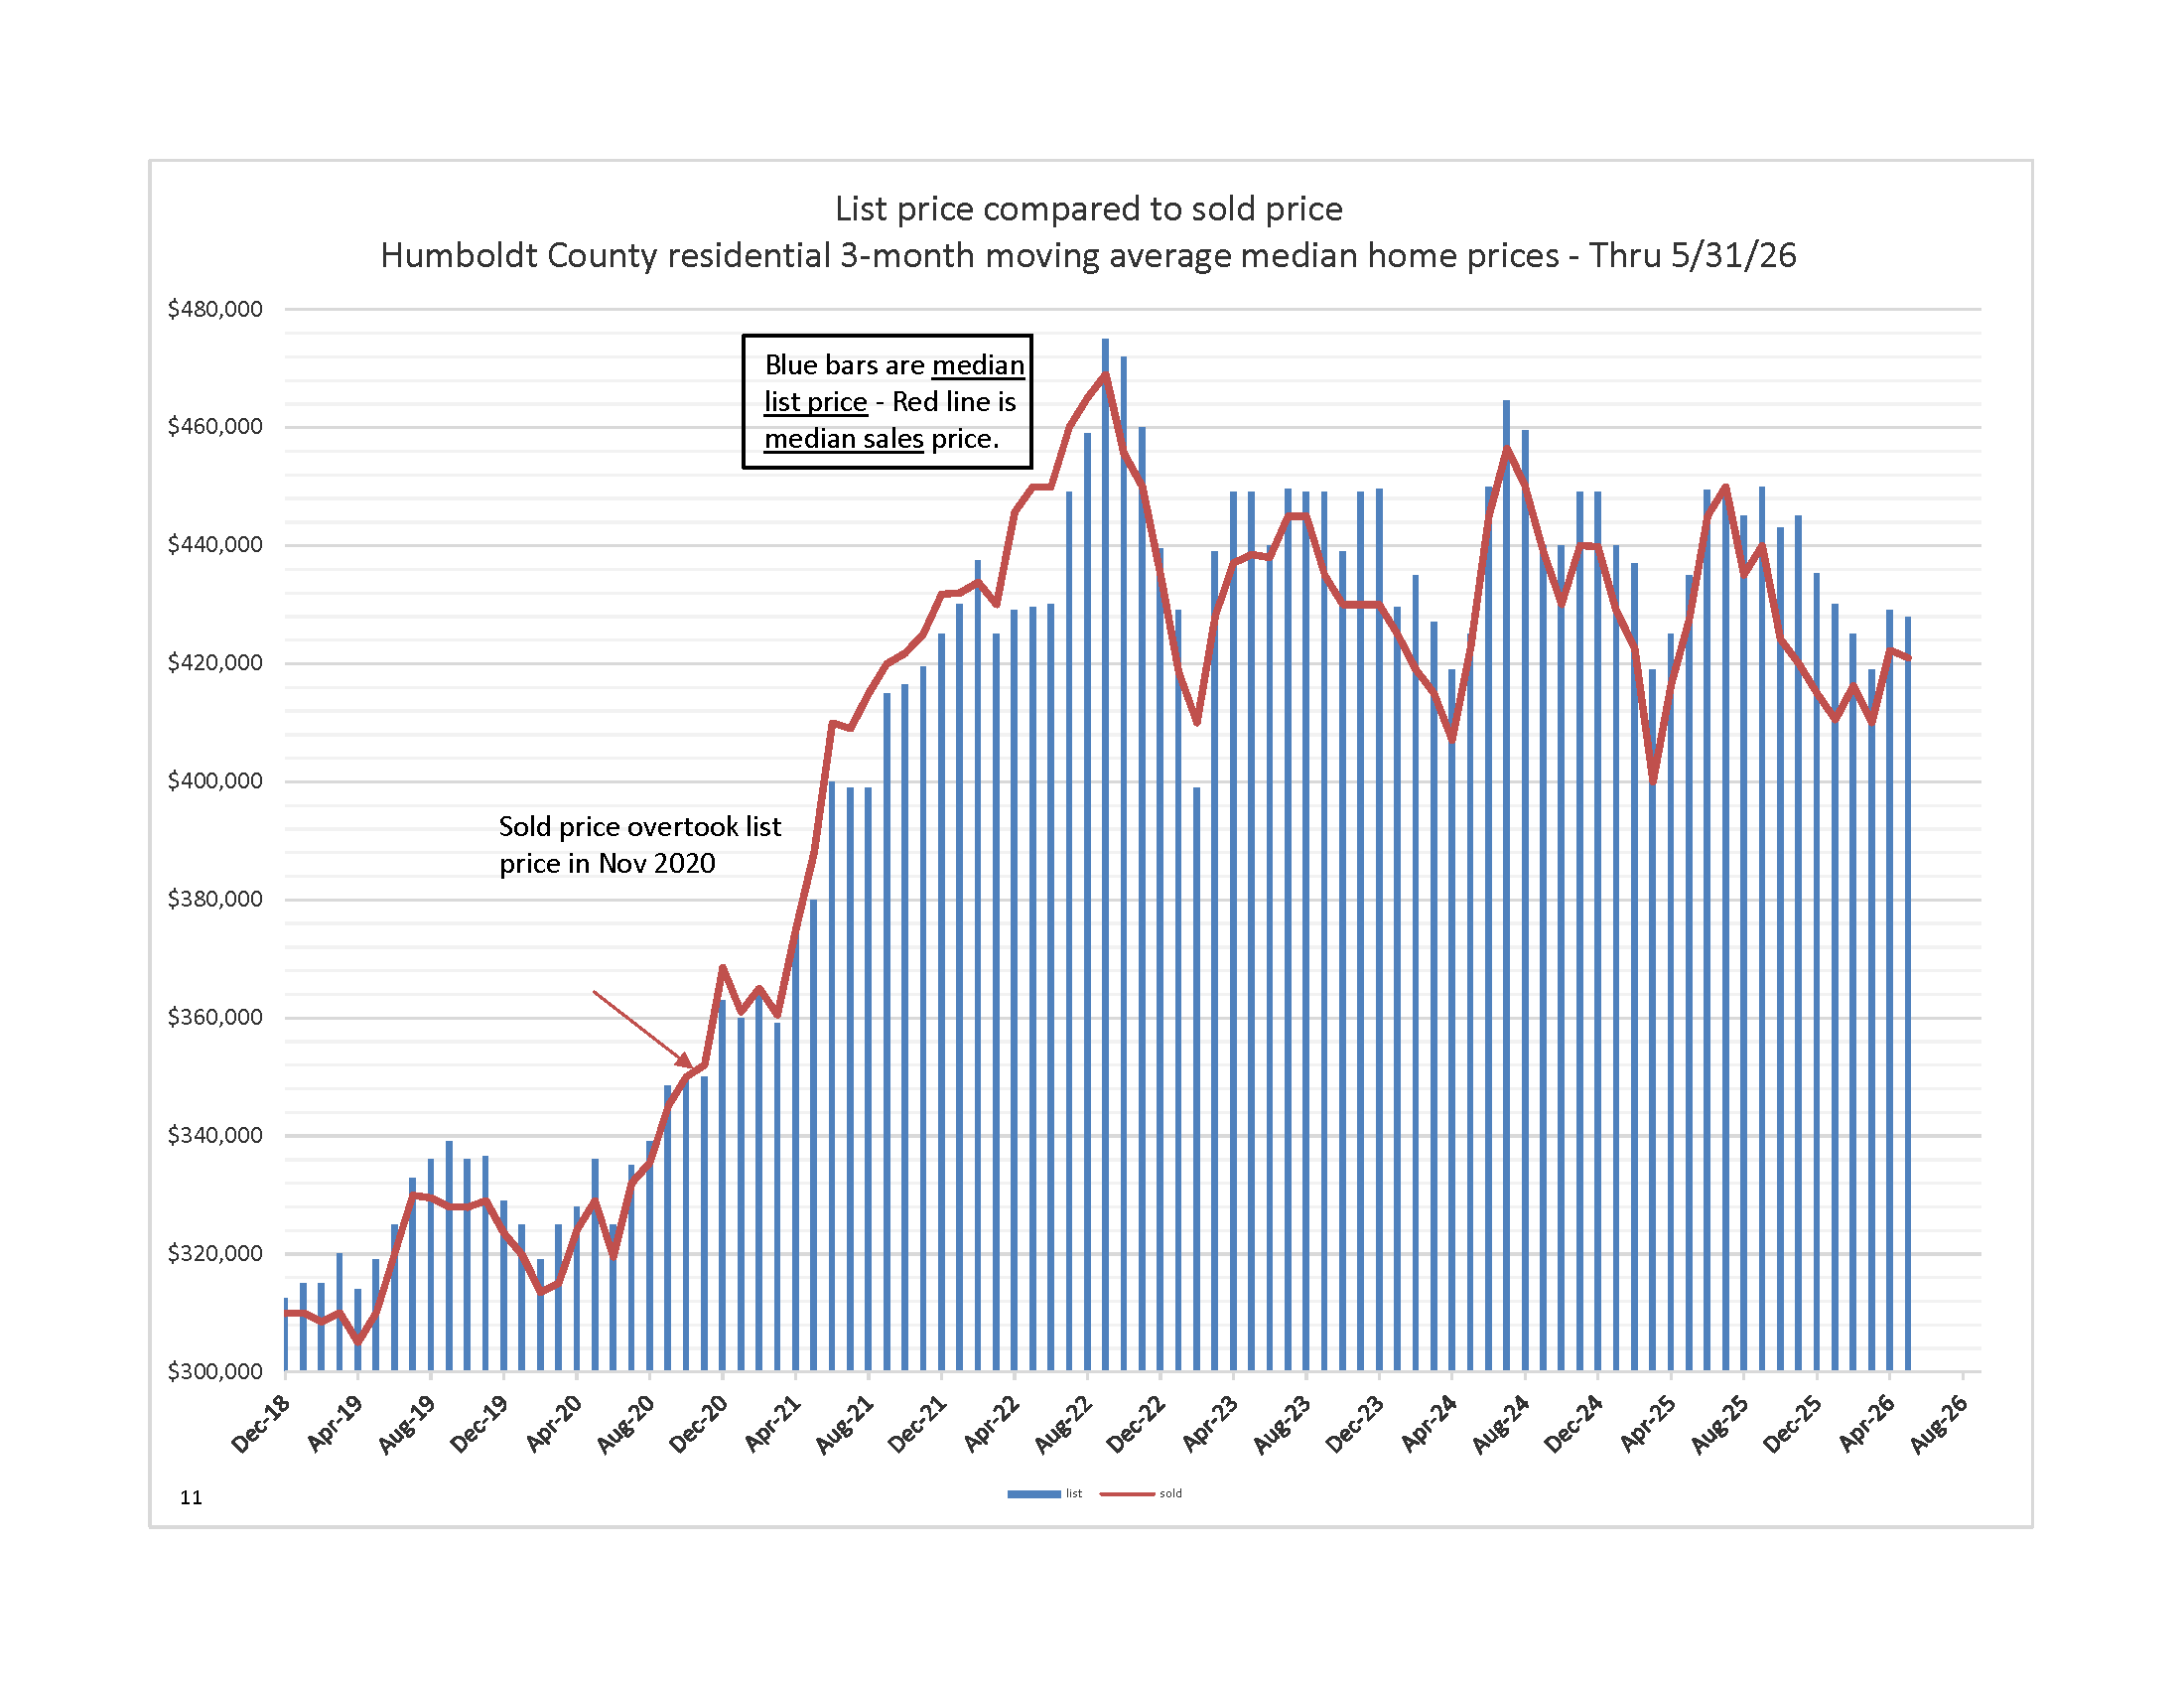
3-month median list price compared to 3-month median sold price
3-month median list price compared to 3-month median sold price. May was a bit abnormal in that both the 3-month list price and the sold price decreased. It wasn’t much. The 3-month median list price decreased from $429,000 in April to $427,500 in May, and the 3-month Median sold price from $422,500 in April to $421,000 in May. What is abnormal is that they decreased! During the four and a half years we have been range-bound, these numbers have consistently increased during the buying season. This is a change in behavior worth noting.
The monthly charts are updated through May 2026