

Active Residences (Current Inventory)
Active residences (current inventory) – The supply of homes on the market is currently outpacing demand, as the inventory of homes rose again this month from 532 homes on June 5 to 550 on July 6, with a high of 556 so far this year. It is not unusual for inventory to continue rising into late summer before entering the annual down cycle into spring.
Median Prices
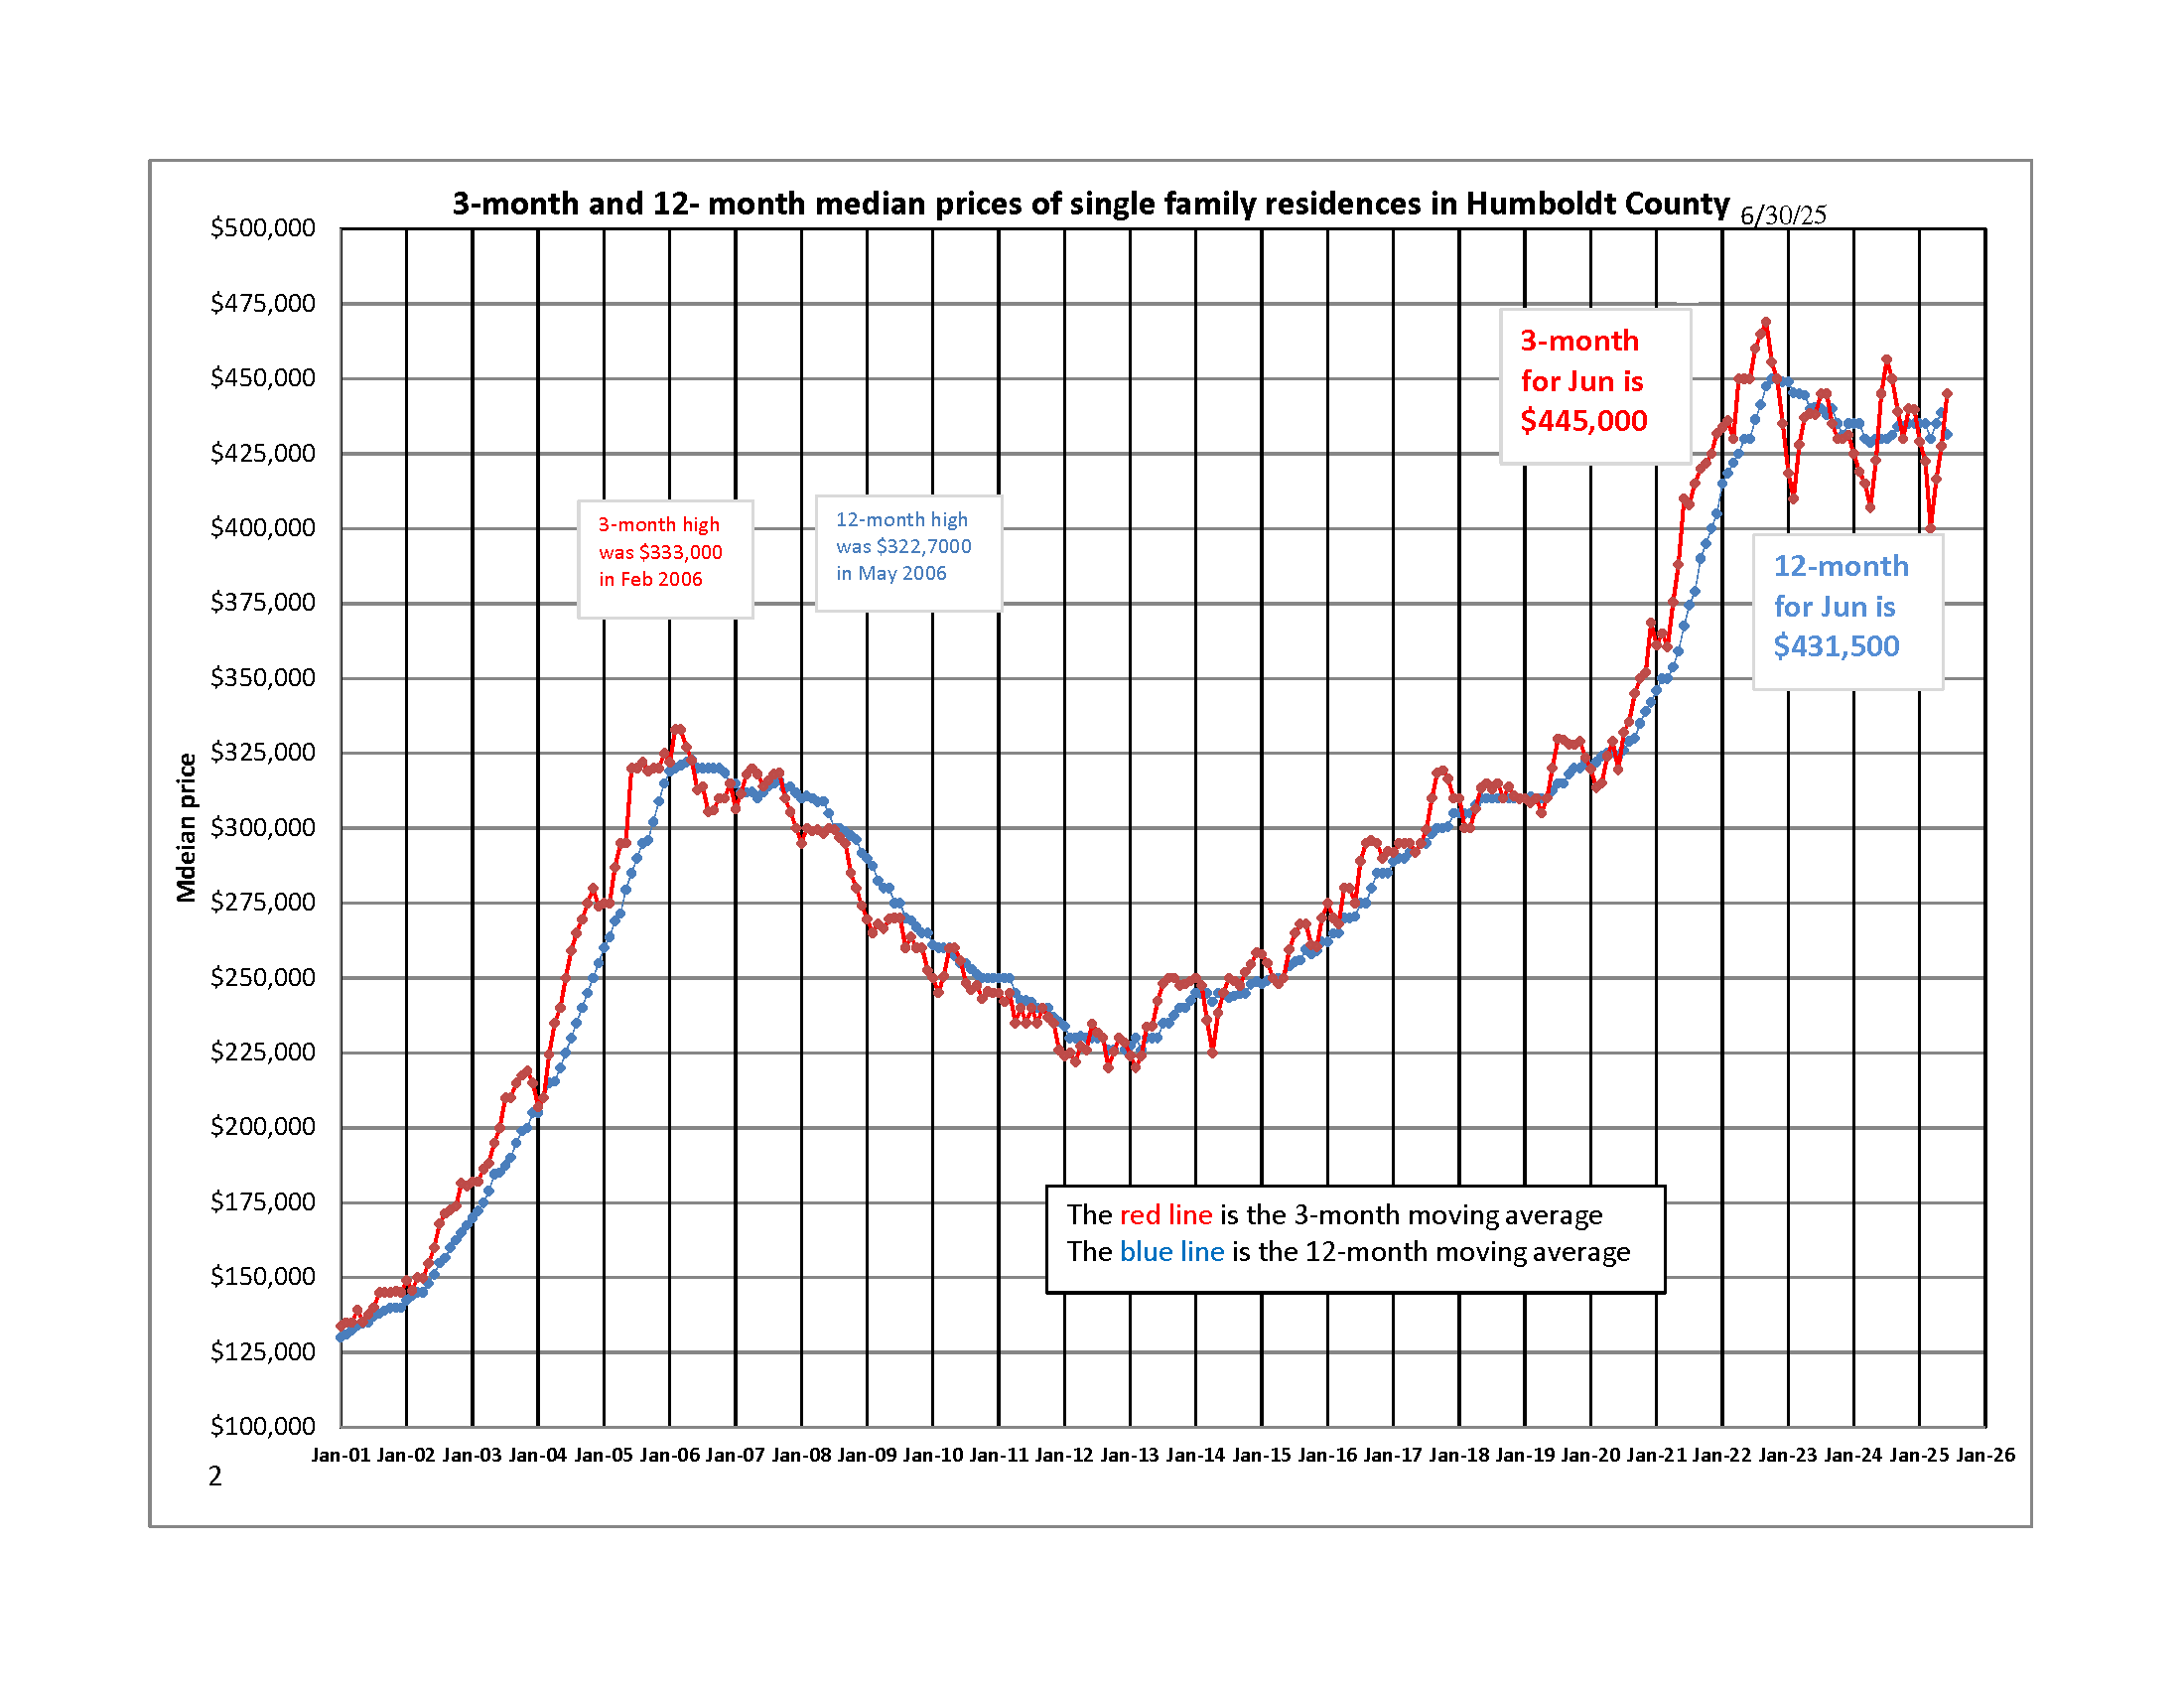
3 & 12-Month Median Prices. With the buying season still ongoing, the 3-month median price continued to rise in June to $445,000 from $427,500 in May. This fluctuation in prices is currently a part of the range-bound annual cycle and is likely to continue until we break out of the current price range. The 12-month median price is a slower-moving trend and decreased from May to June due to the lower prices earlier in the year. It should begin to bounce back in the months ahead.
Median Days on Market For homes sold over the past 30 days
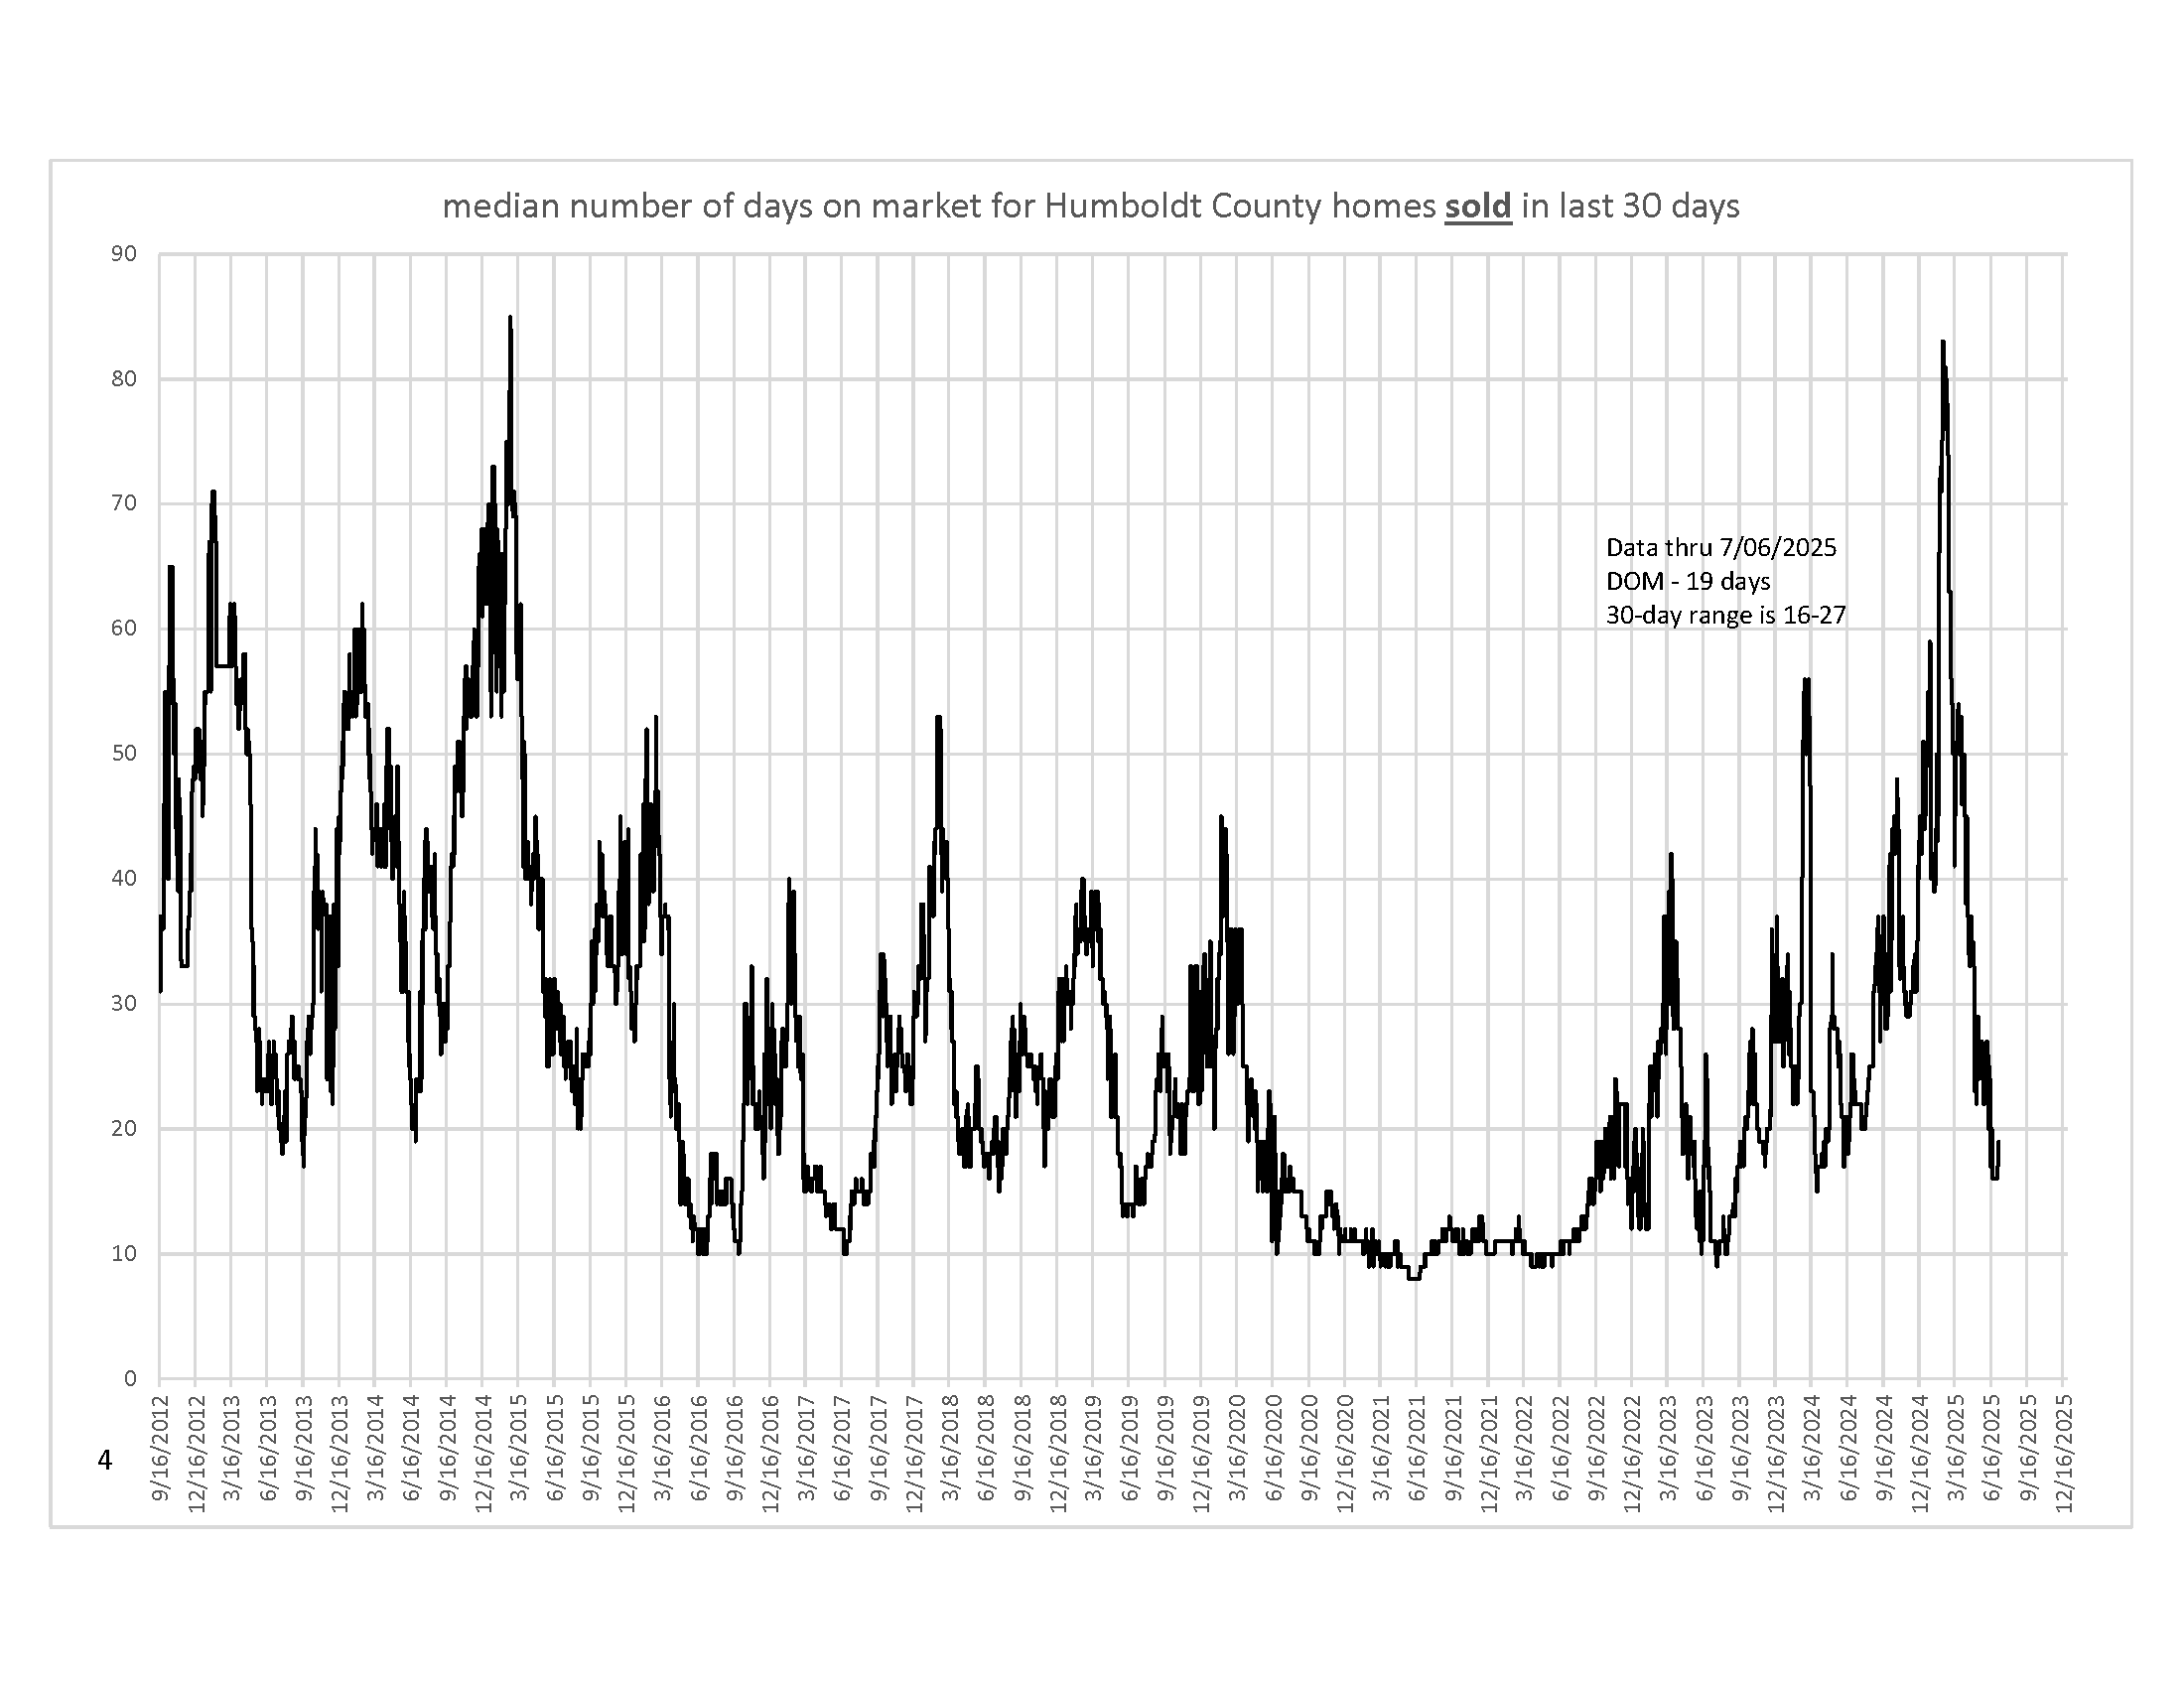
Median DOM (days on market - the time it takes for 50% of homes to leave the market for homes that sold over the past 30 days). The market picked up the pace in June, with days on market falling to a low of 16 days recently before landing at 19 on July 7. The range over the past 30 days was 16 to 27 days. We are in a similar range as we were at this time last year.
Number of Homes Pending in the Past 30 Days
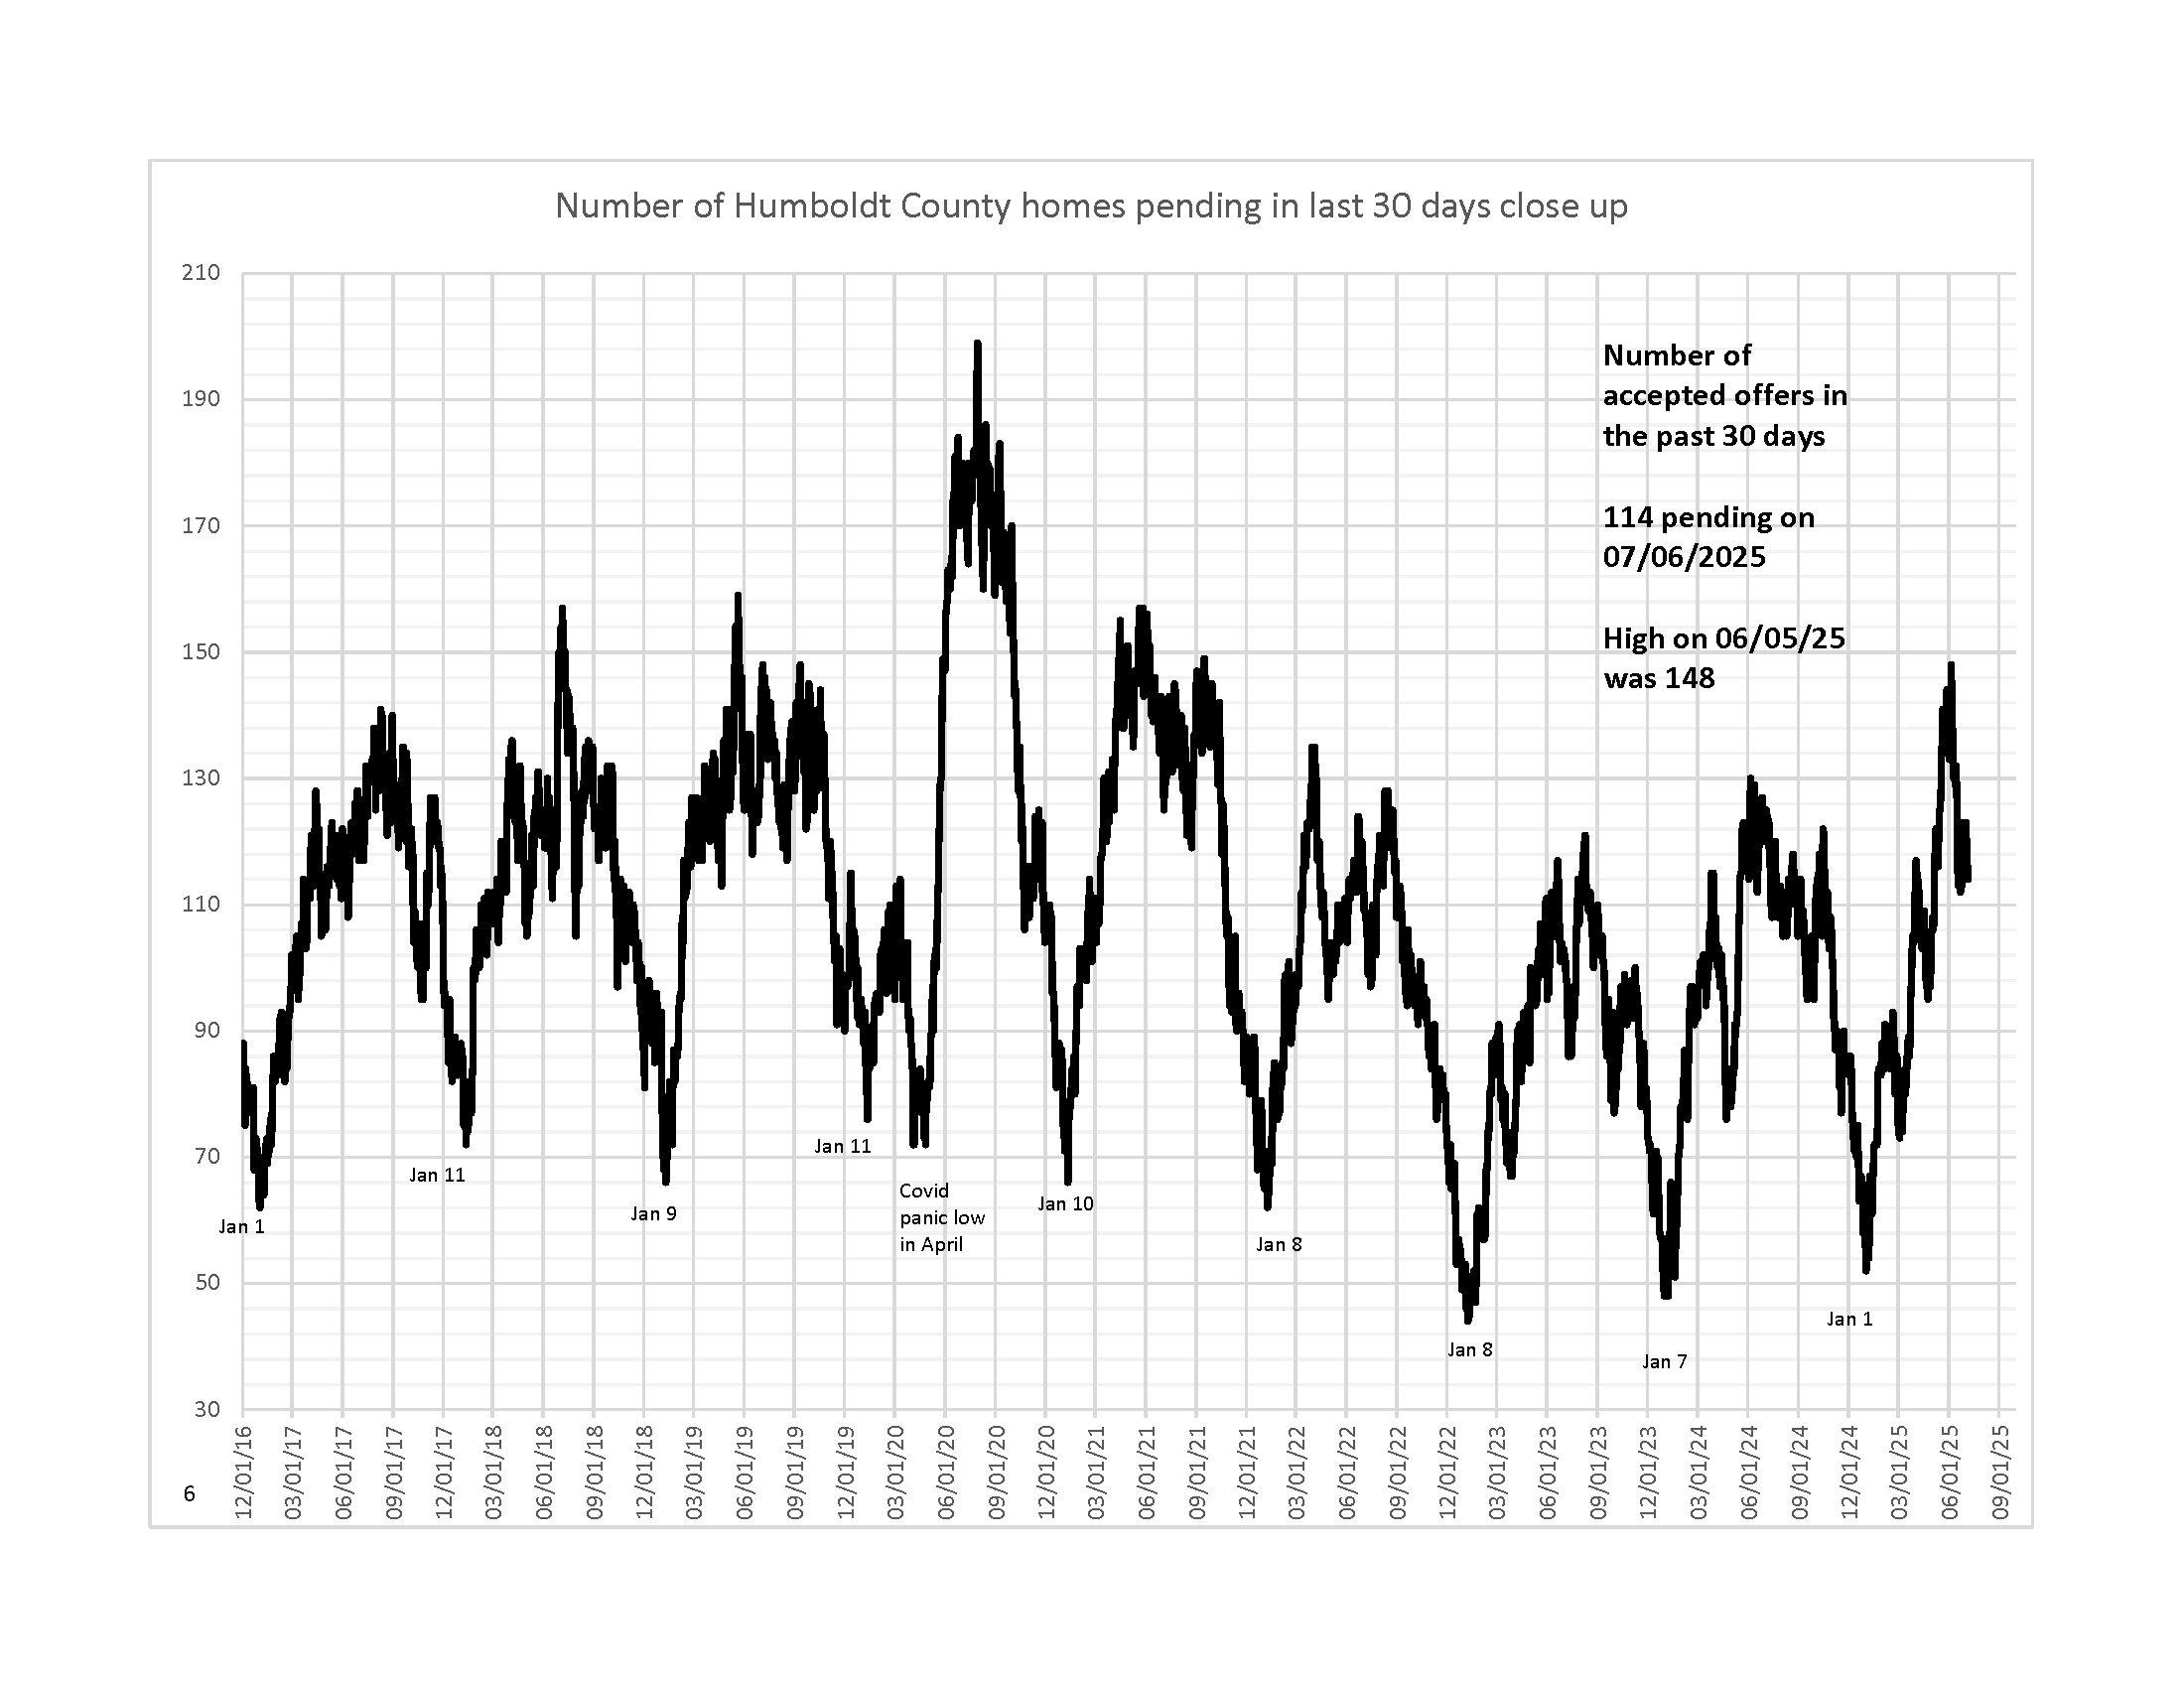
Number of pendings over the last 30 days, close-up. From a high of 148 homes pending during the 30 days up to June 5, we have declined to 114 on July 6. We experienced a rapid rise in home sales in the first part of the year, but sales appear to be slowing down as we enter the summer months. This is a common occurrence in the buying cycle. Home sales typically begin to decline slowly from this time of year into the first part of January.
Homes Sold for 12 Consecutive Months
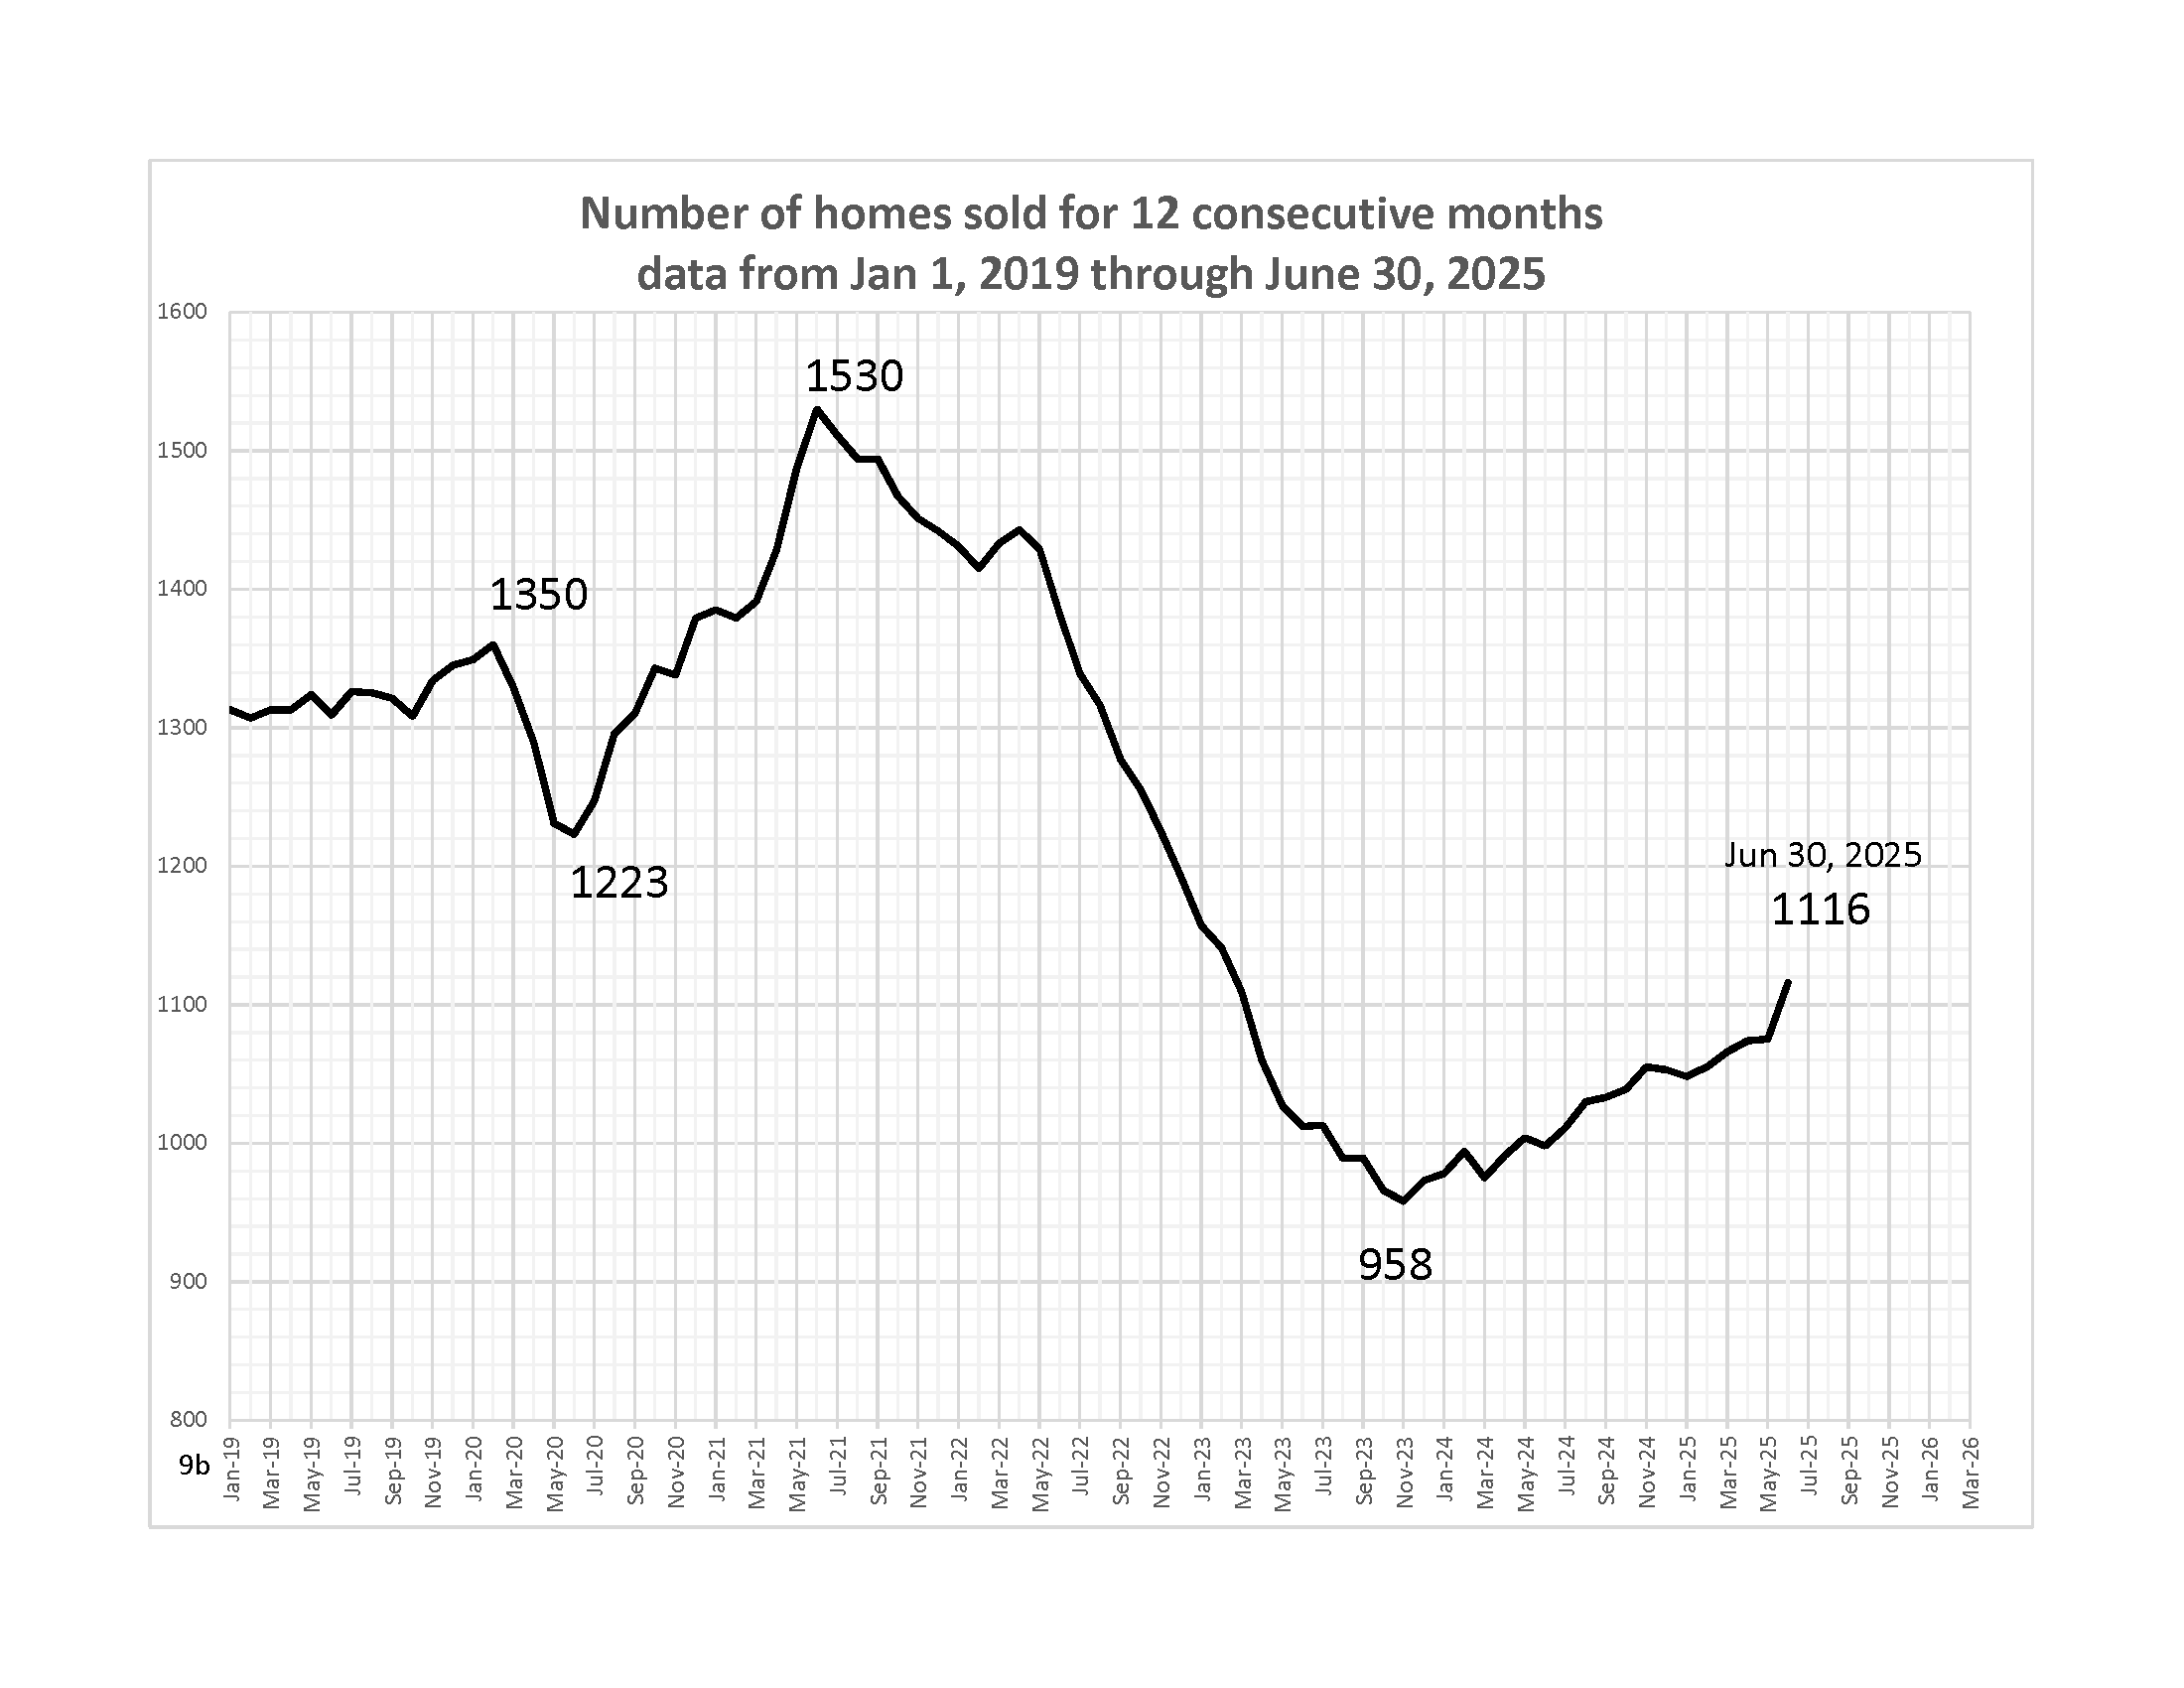
Homes sold for 12 Consecutive Months. Last month, I wrote,” With the number of pending sales increasing over the past month, there is hope that this trend will continue to climb.” Due to the increase in homes going into escrow earlier in the year, sales numbers for 12 consecutive months continued to climb from 1074 in May to 1116 homes sold in June. This upward trend in sales has been going on for a year and a half.

3-month median list price compared to 3-month median sold price
3-month median list price compared to 3-month median sold price. Both the 3-month median list price and the 3-month median sales price continued to climb into June. The list price rose from $435,000 to $449,450, and the median sales price rose from $427,500 to $445,000. Based on the previous two years, we can expect another rise in July before peaking.