
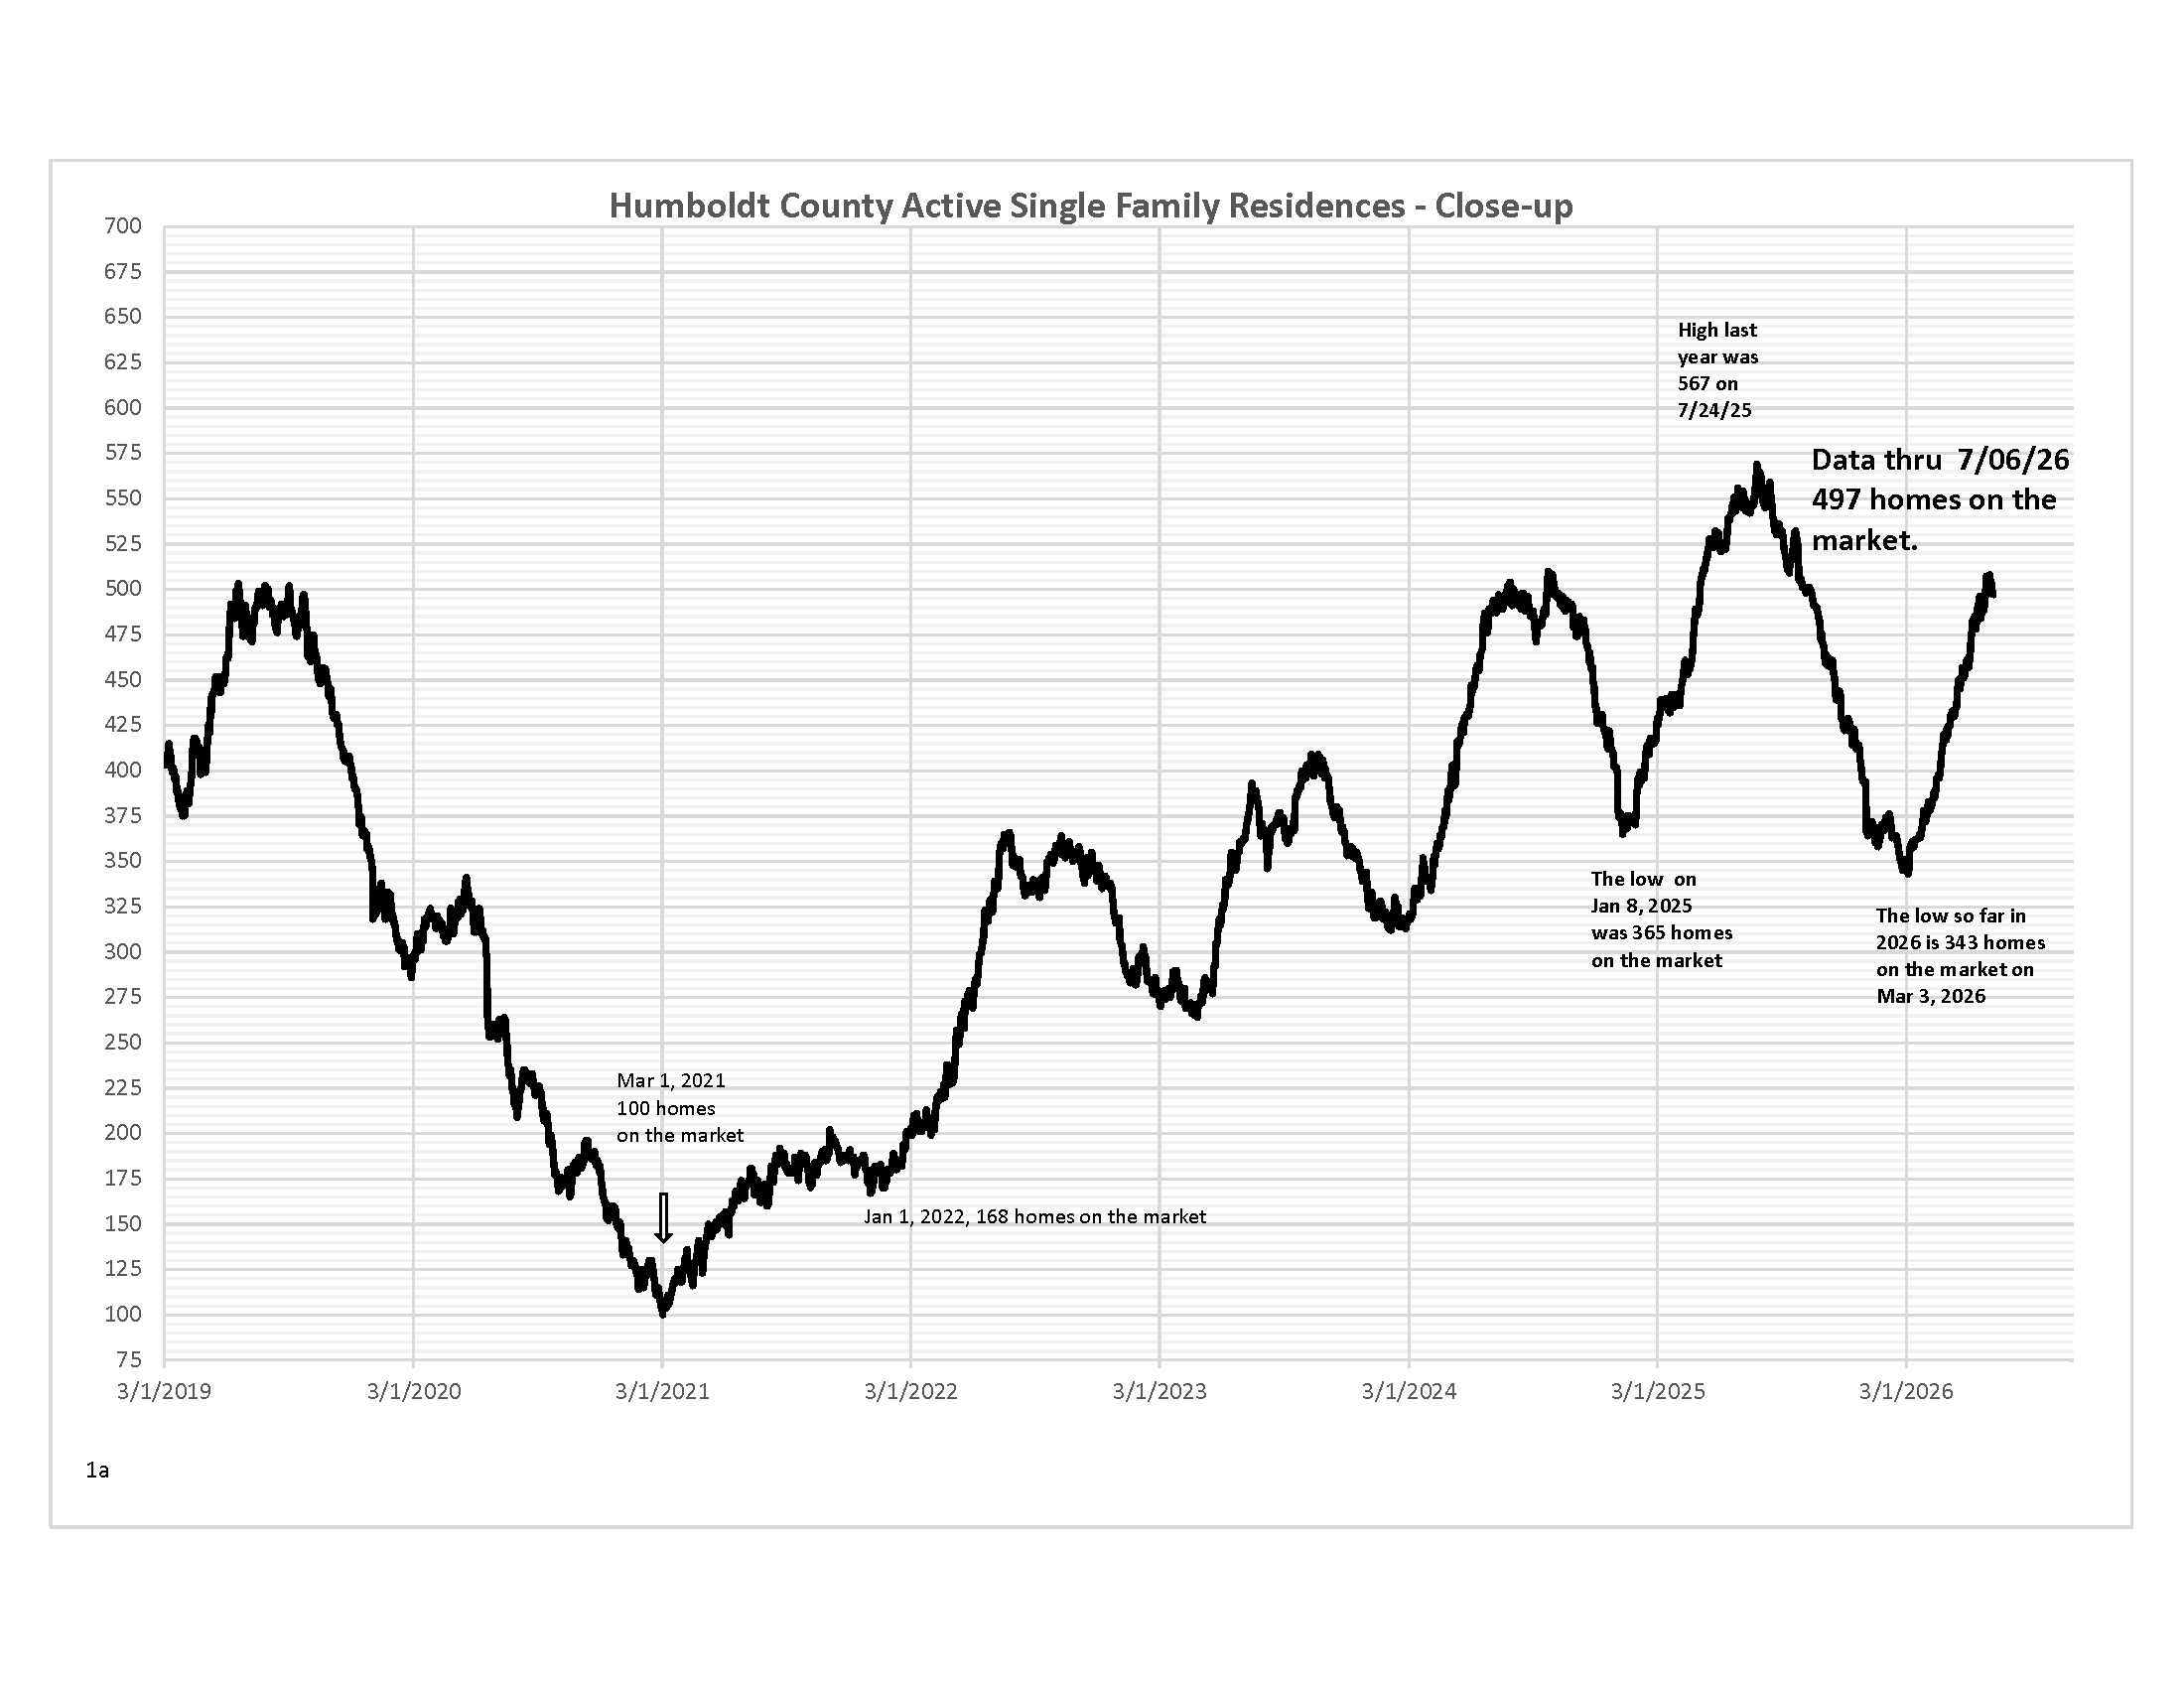
Active Residences (Current Inventory)
Active residences (current inventory) – Inventory reached 497 homes on the market on July 6, 2026, an increase from 483 on June 7, 2026, but still lower than the 525 homes available at this time last year. We should see inventory continue to increase into the next several weeks, but it is getting late in the season now. The peak in inventory last year was on July 24, 2025, with 567 homes on the market.
The monthly charts are updated through May 2026

Median Prices
3 & 12-Month Median Prices. From the modest dip in prices last month, we rebounded this month with a robust rise in the 3-month median price. From the $421,500 3-month median price in May, we jumped to $435,000 in June. This has been normal during the buying season and keeps us in the range-bound pattern. The 12-month median price had a more modest increase, moving from $424,000 in May back to $425,000, where it had been for six months.
The monthly charts are updated through May 2026
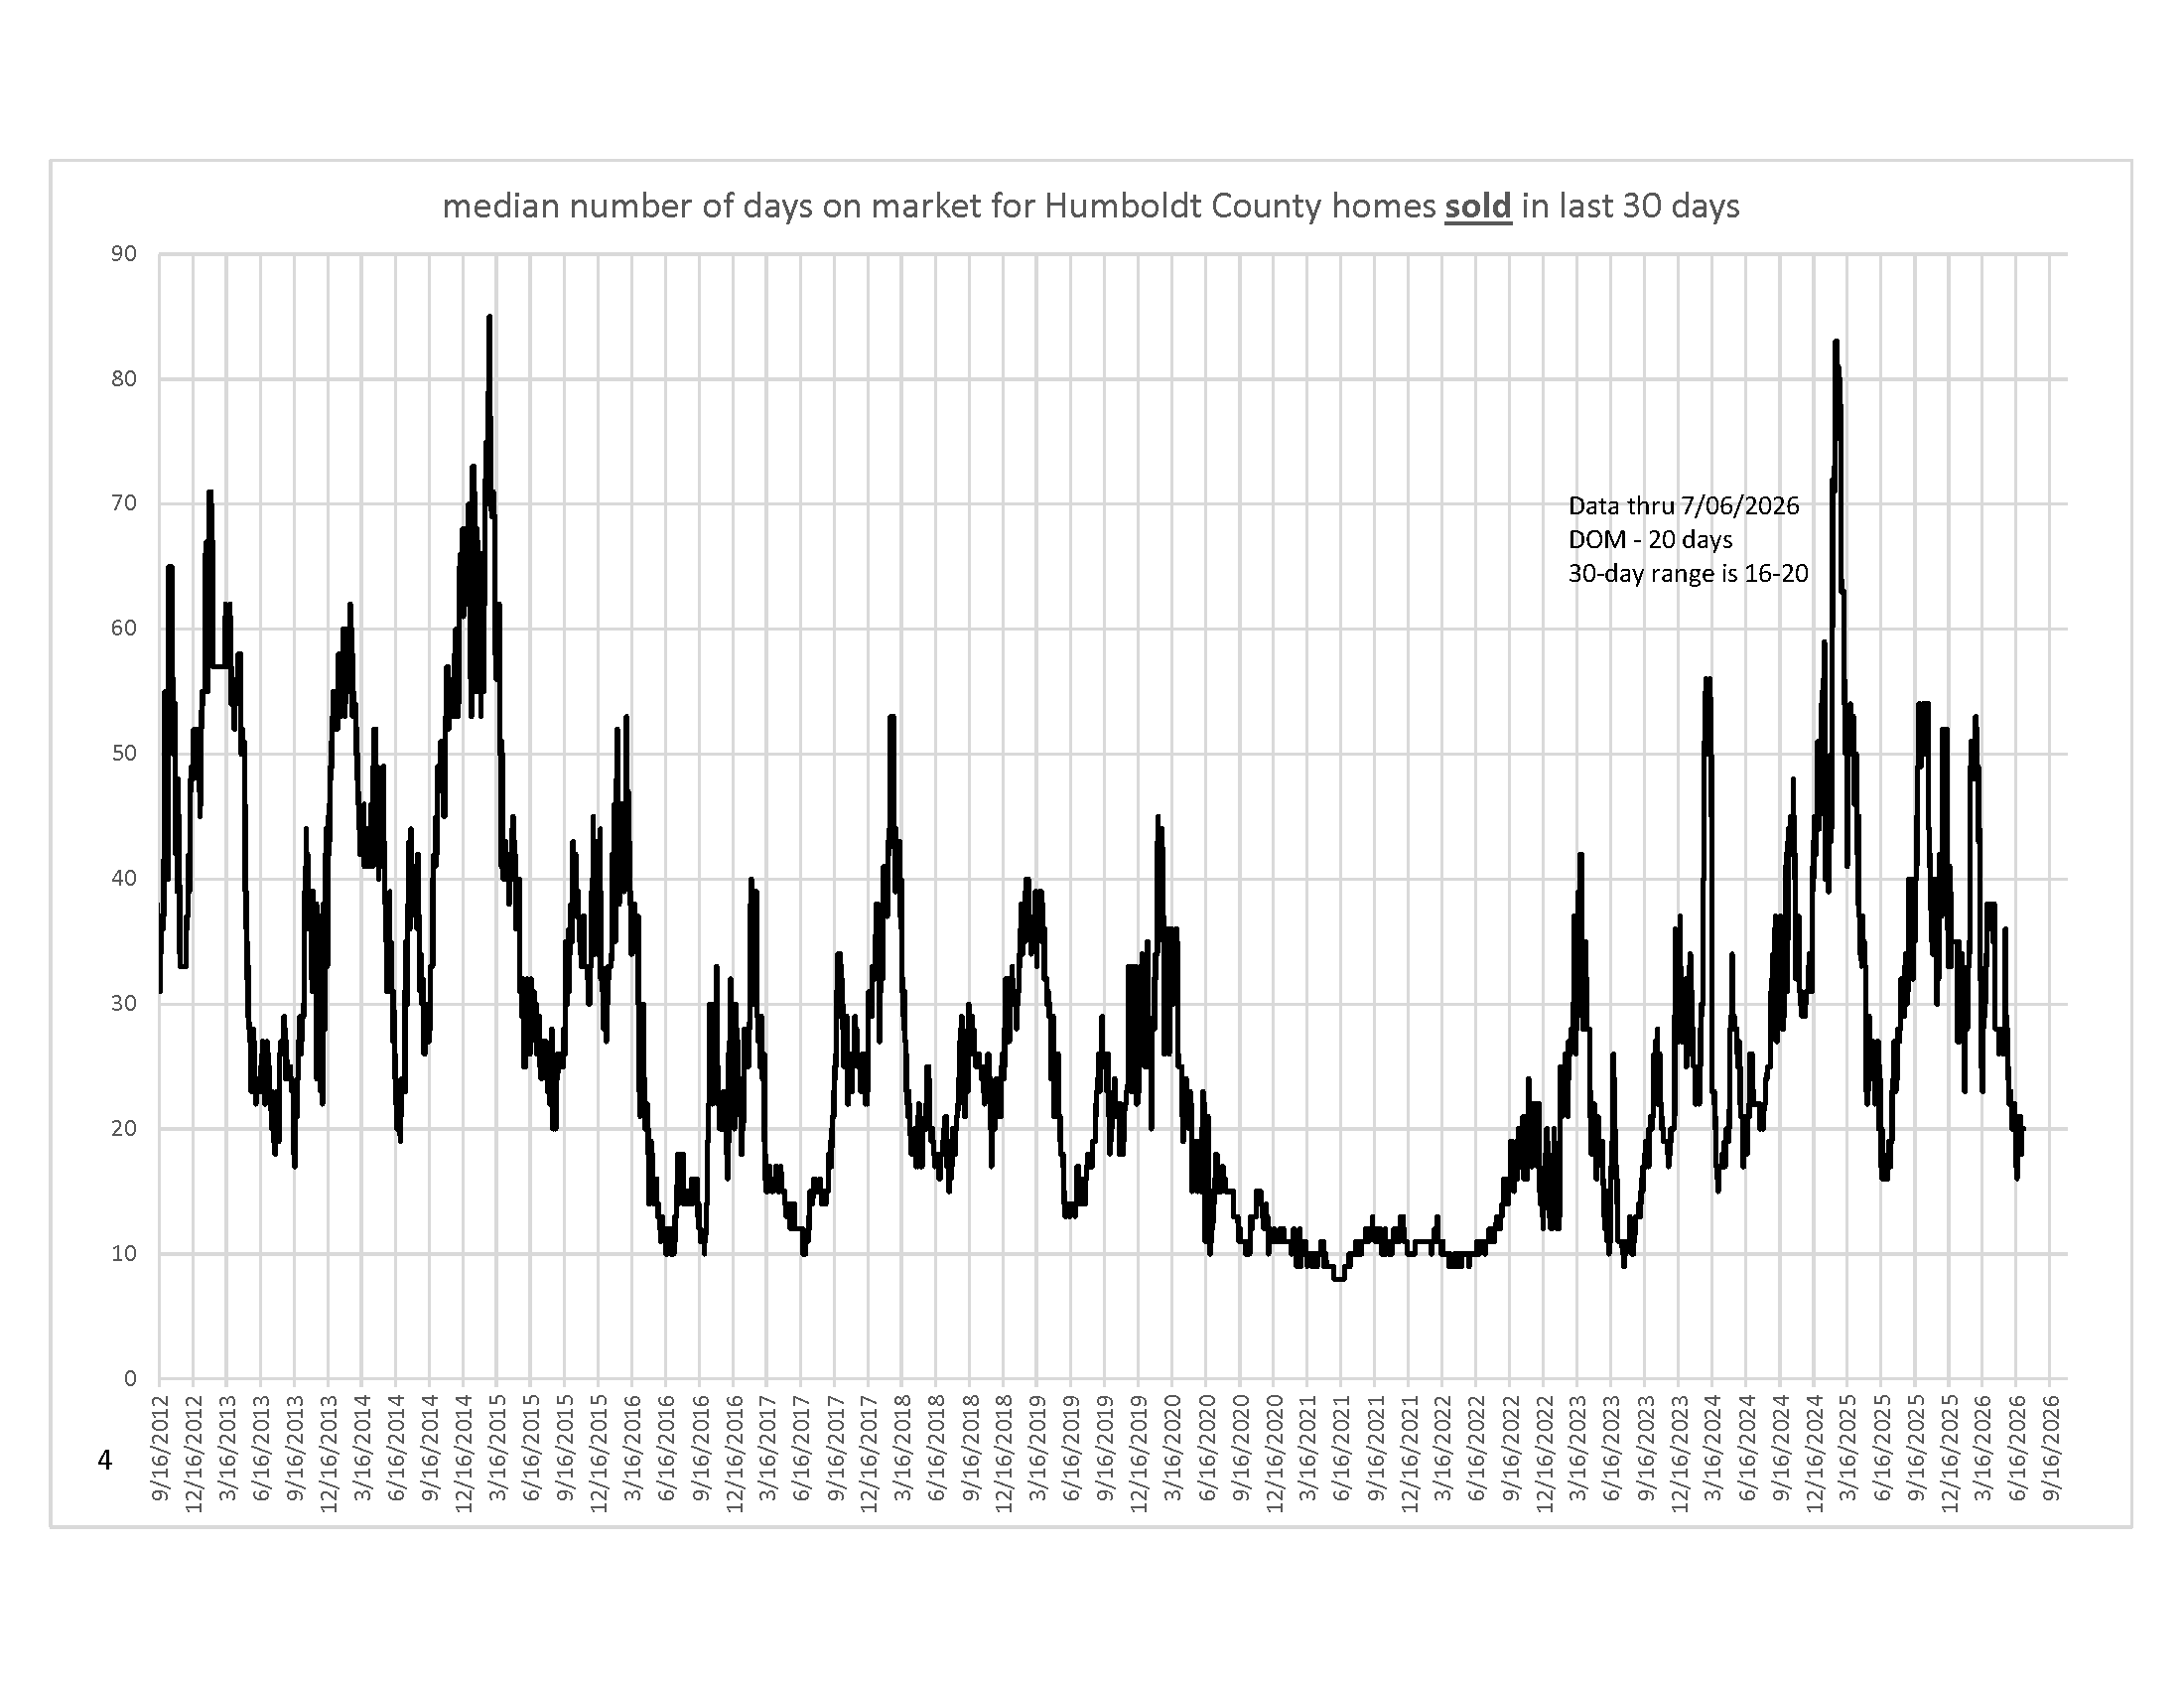
Median Days on Market For homes sold over the past 30 days
Median DOM (days on market - the time it takes for 50% of homes to leave the market for homes that sold over the past 30 days). The median days on the market remained the same at 20 on July 6, 2025, as it was on June 7, 2026. The difference this month is that the range was much tighter at 16-20 days than it has been over the past several months. Last month, the range was 20-36. This smaller range is normal and to be expected during the busy part of the buying season.
The monthly charts are updated through May 2026
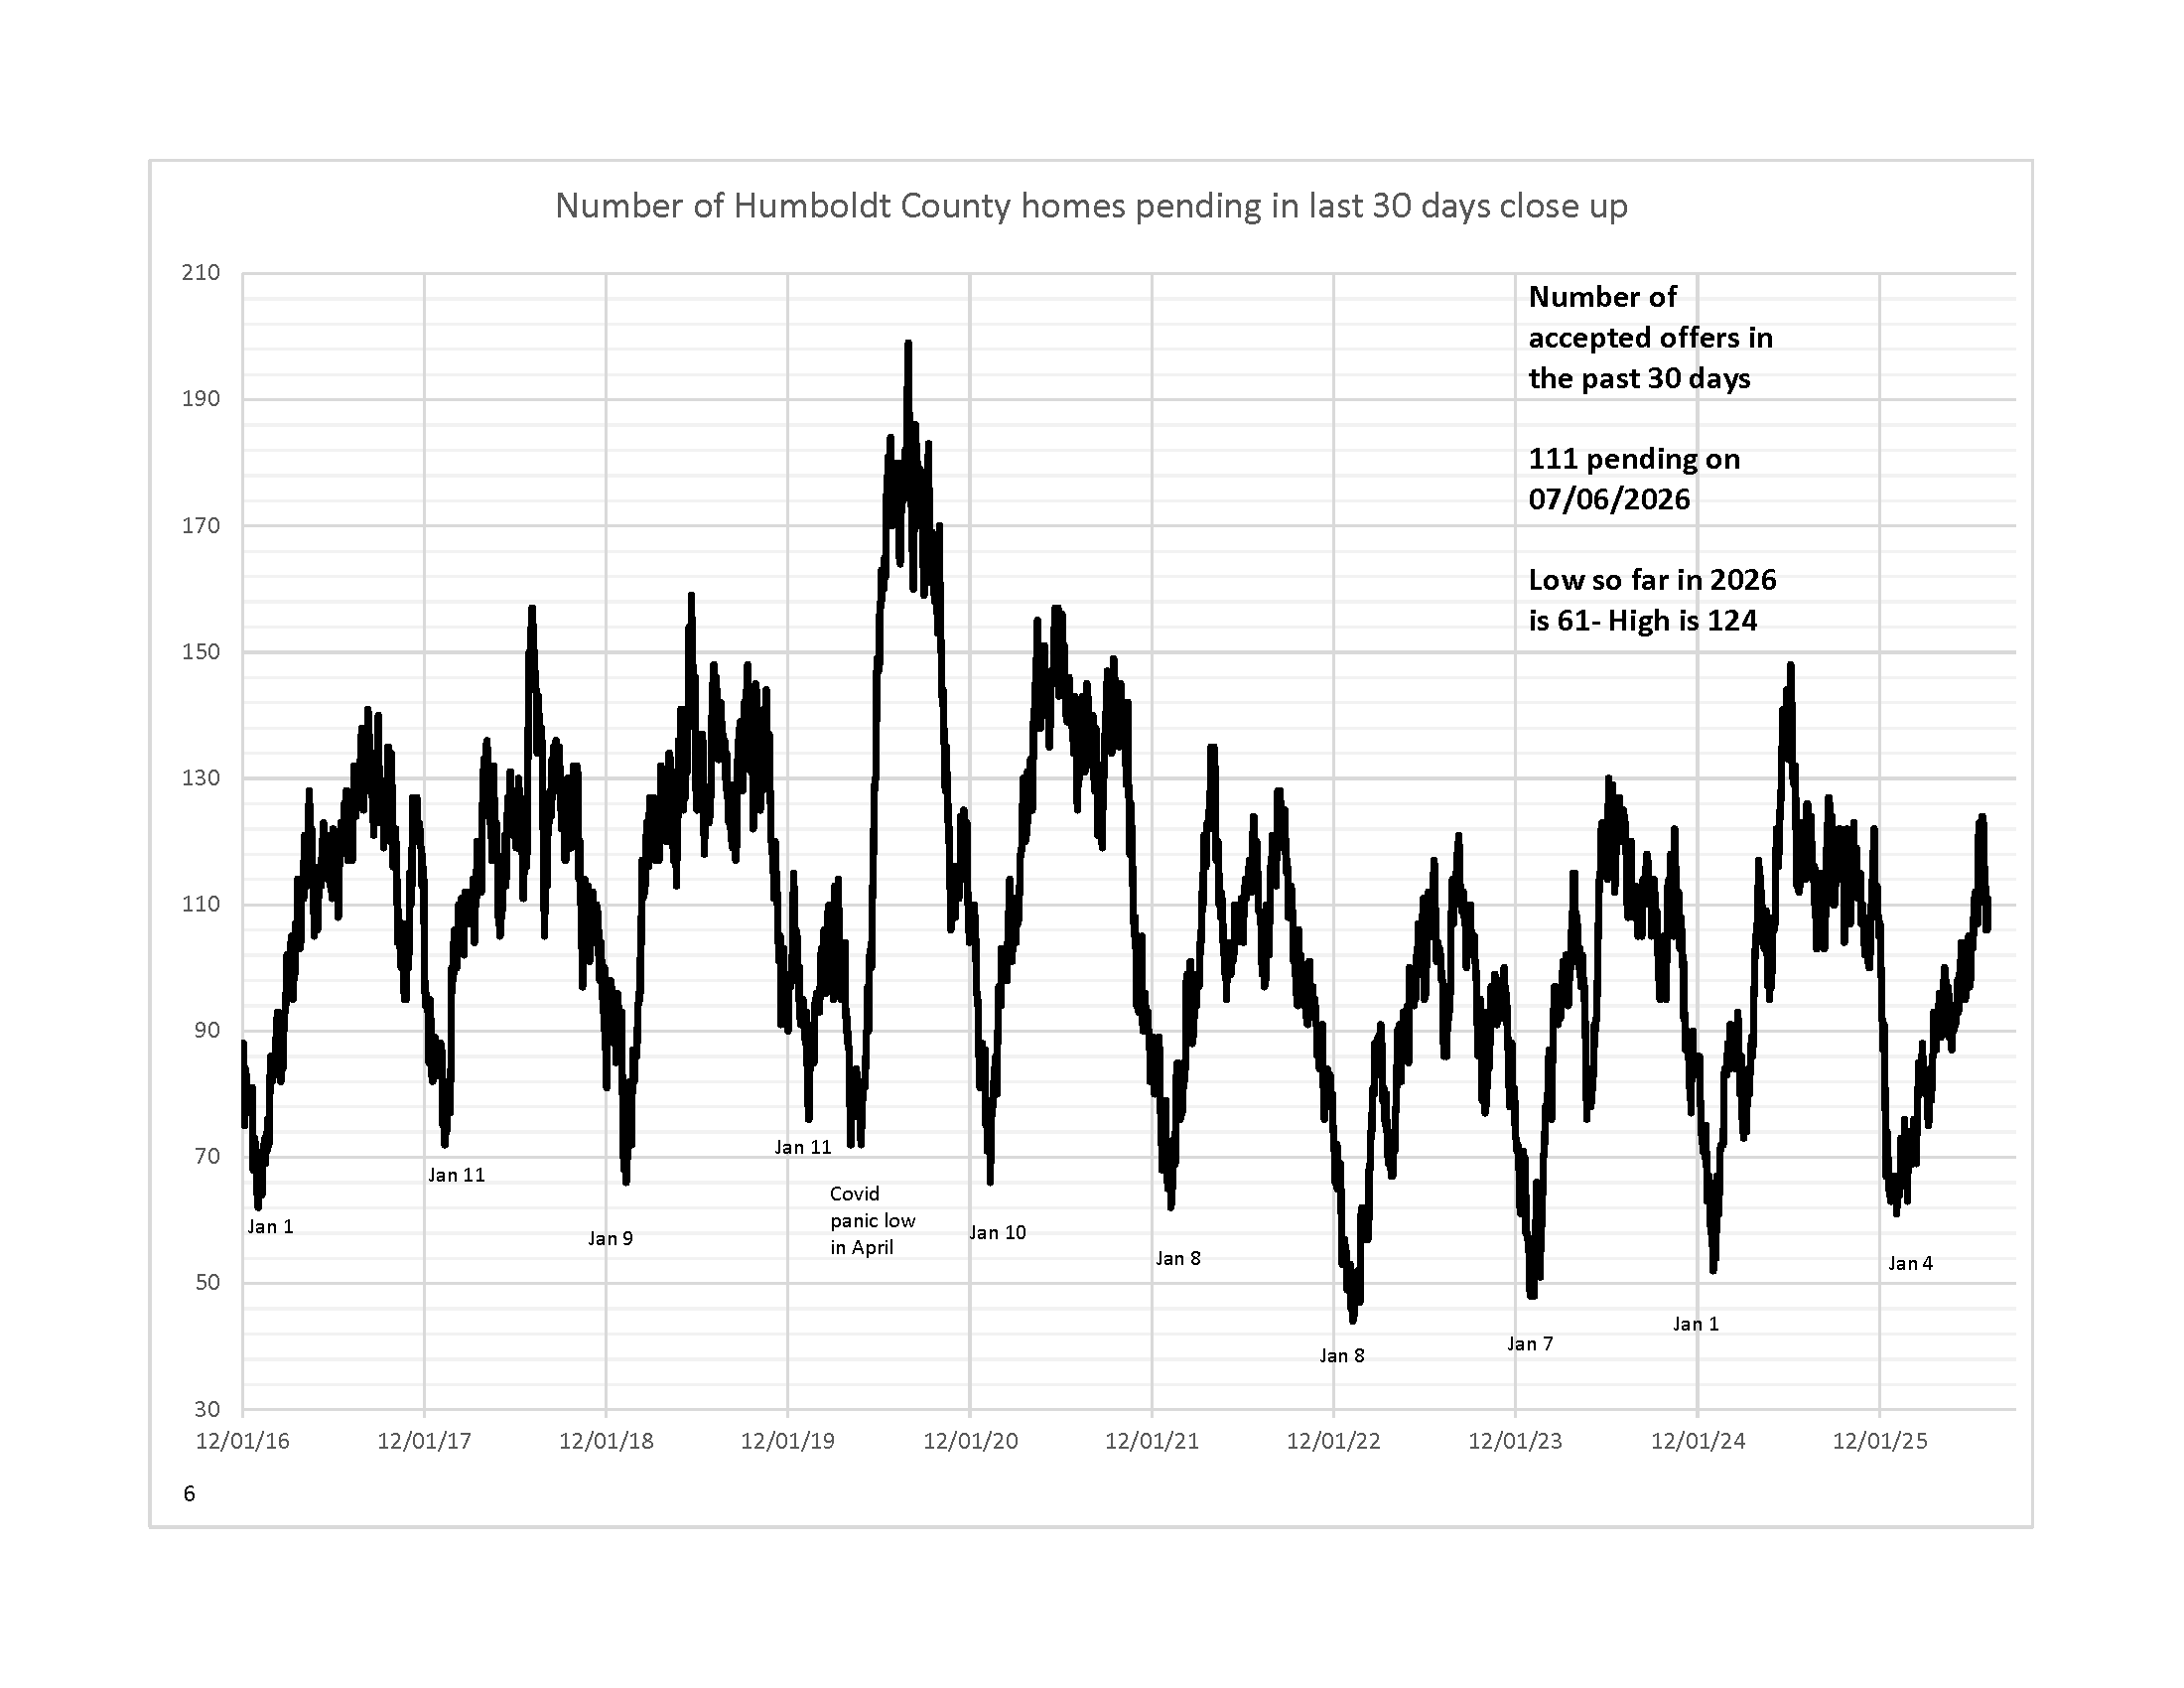
Number of Homes Pending in the Past 30 Days
Number of pendings over the last 30 days, close-up. The number of pending sales has been lower this year than last year. Our high so far this year is 124 on June 26, 2026, compared to 148 on June 5, 2025. The number of pendings over the past 30 days was 111 on July 6, 2026, and we typically begin a slow decline in 30-day pending sales around this time of year.
The monthly charts are updated through May 2026
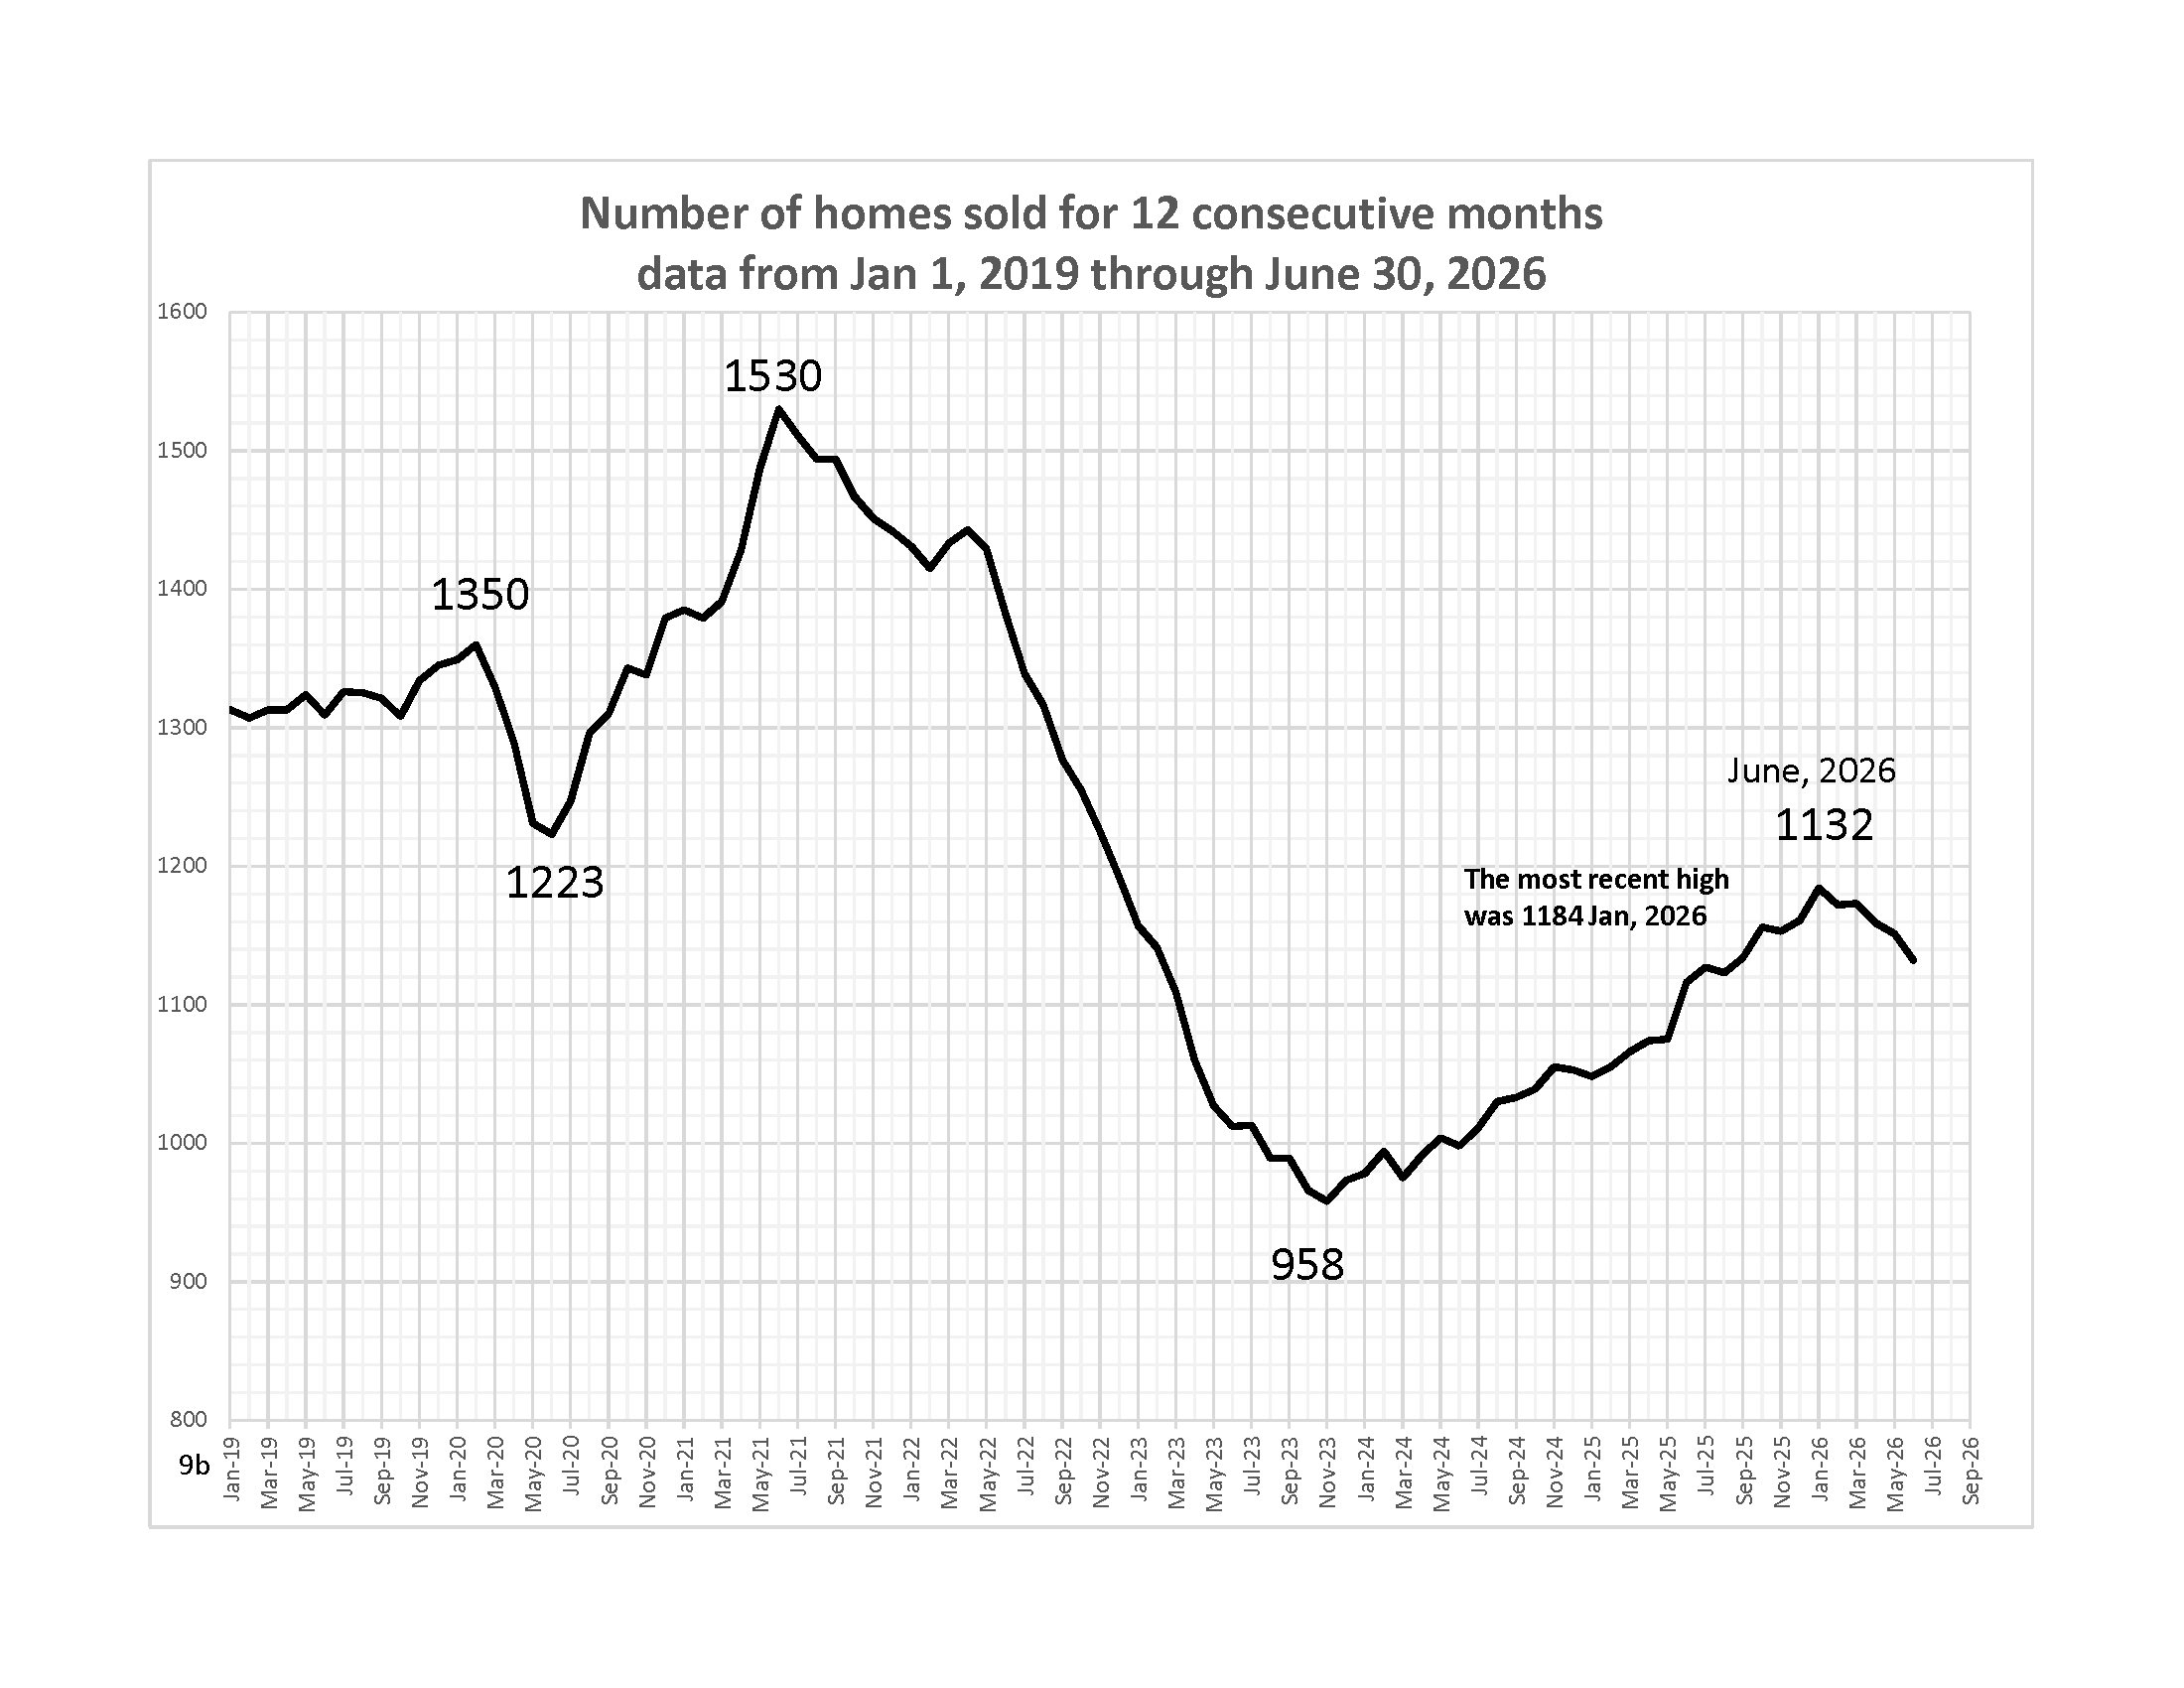
Homes Sold for 12 Consecutive Months
Homes sold for 12 Consecutive Months. Last month, I wrote, “We peaked at 1184 (with homes sold for 12 consecutive months) in January, 2026, and have been slowly decreasing since.” Sales for 12 consecutive months dipped in May, down from 1159 in April to 1151, and now dipping to 1132 in June, 2026. With fewer pending sales than last year, the current trend is for lower total sales at year's end.
The monthly charts are updated through May 2026
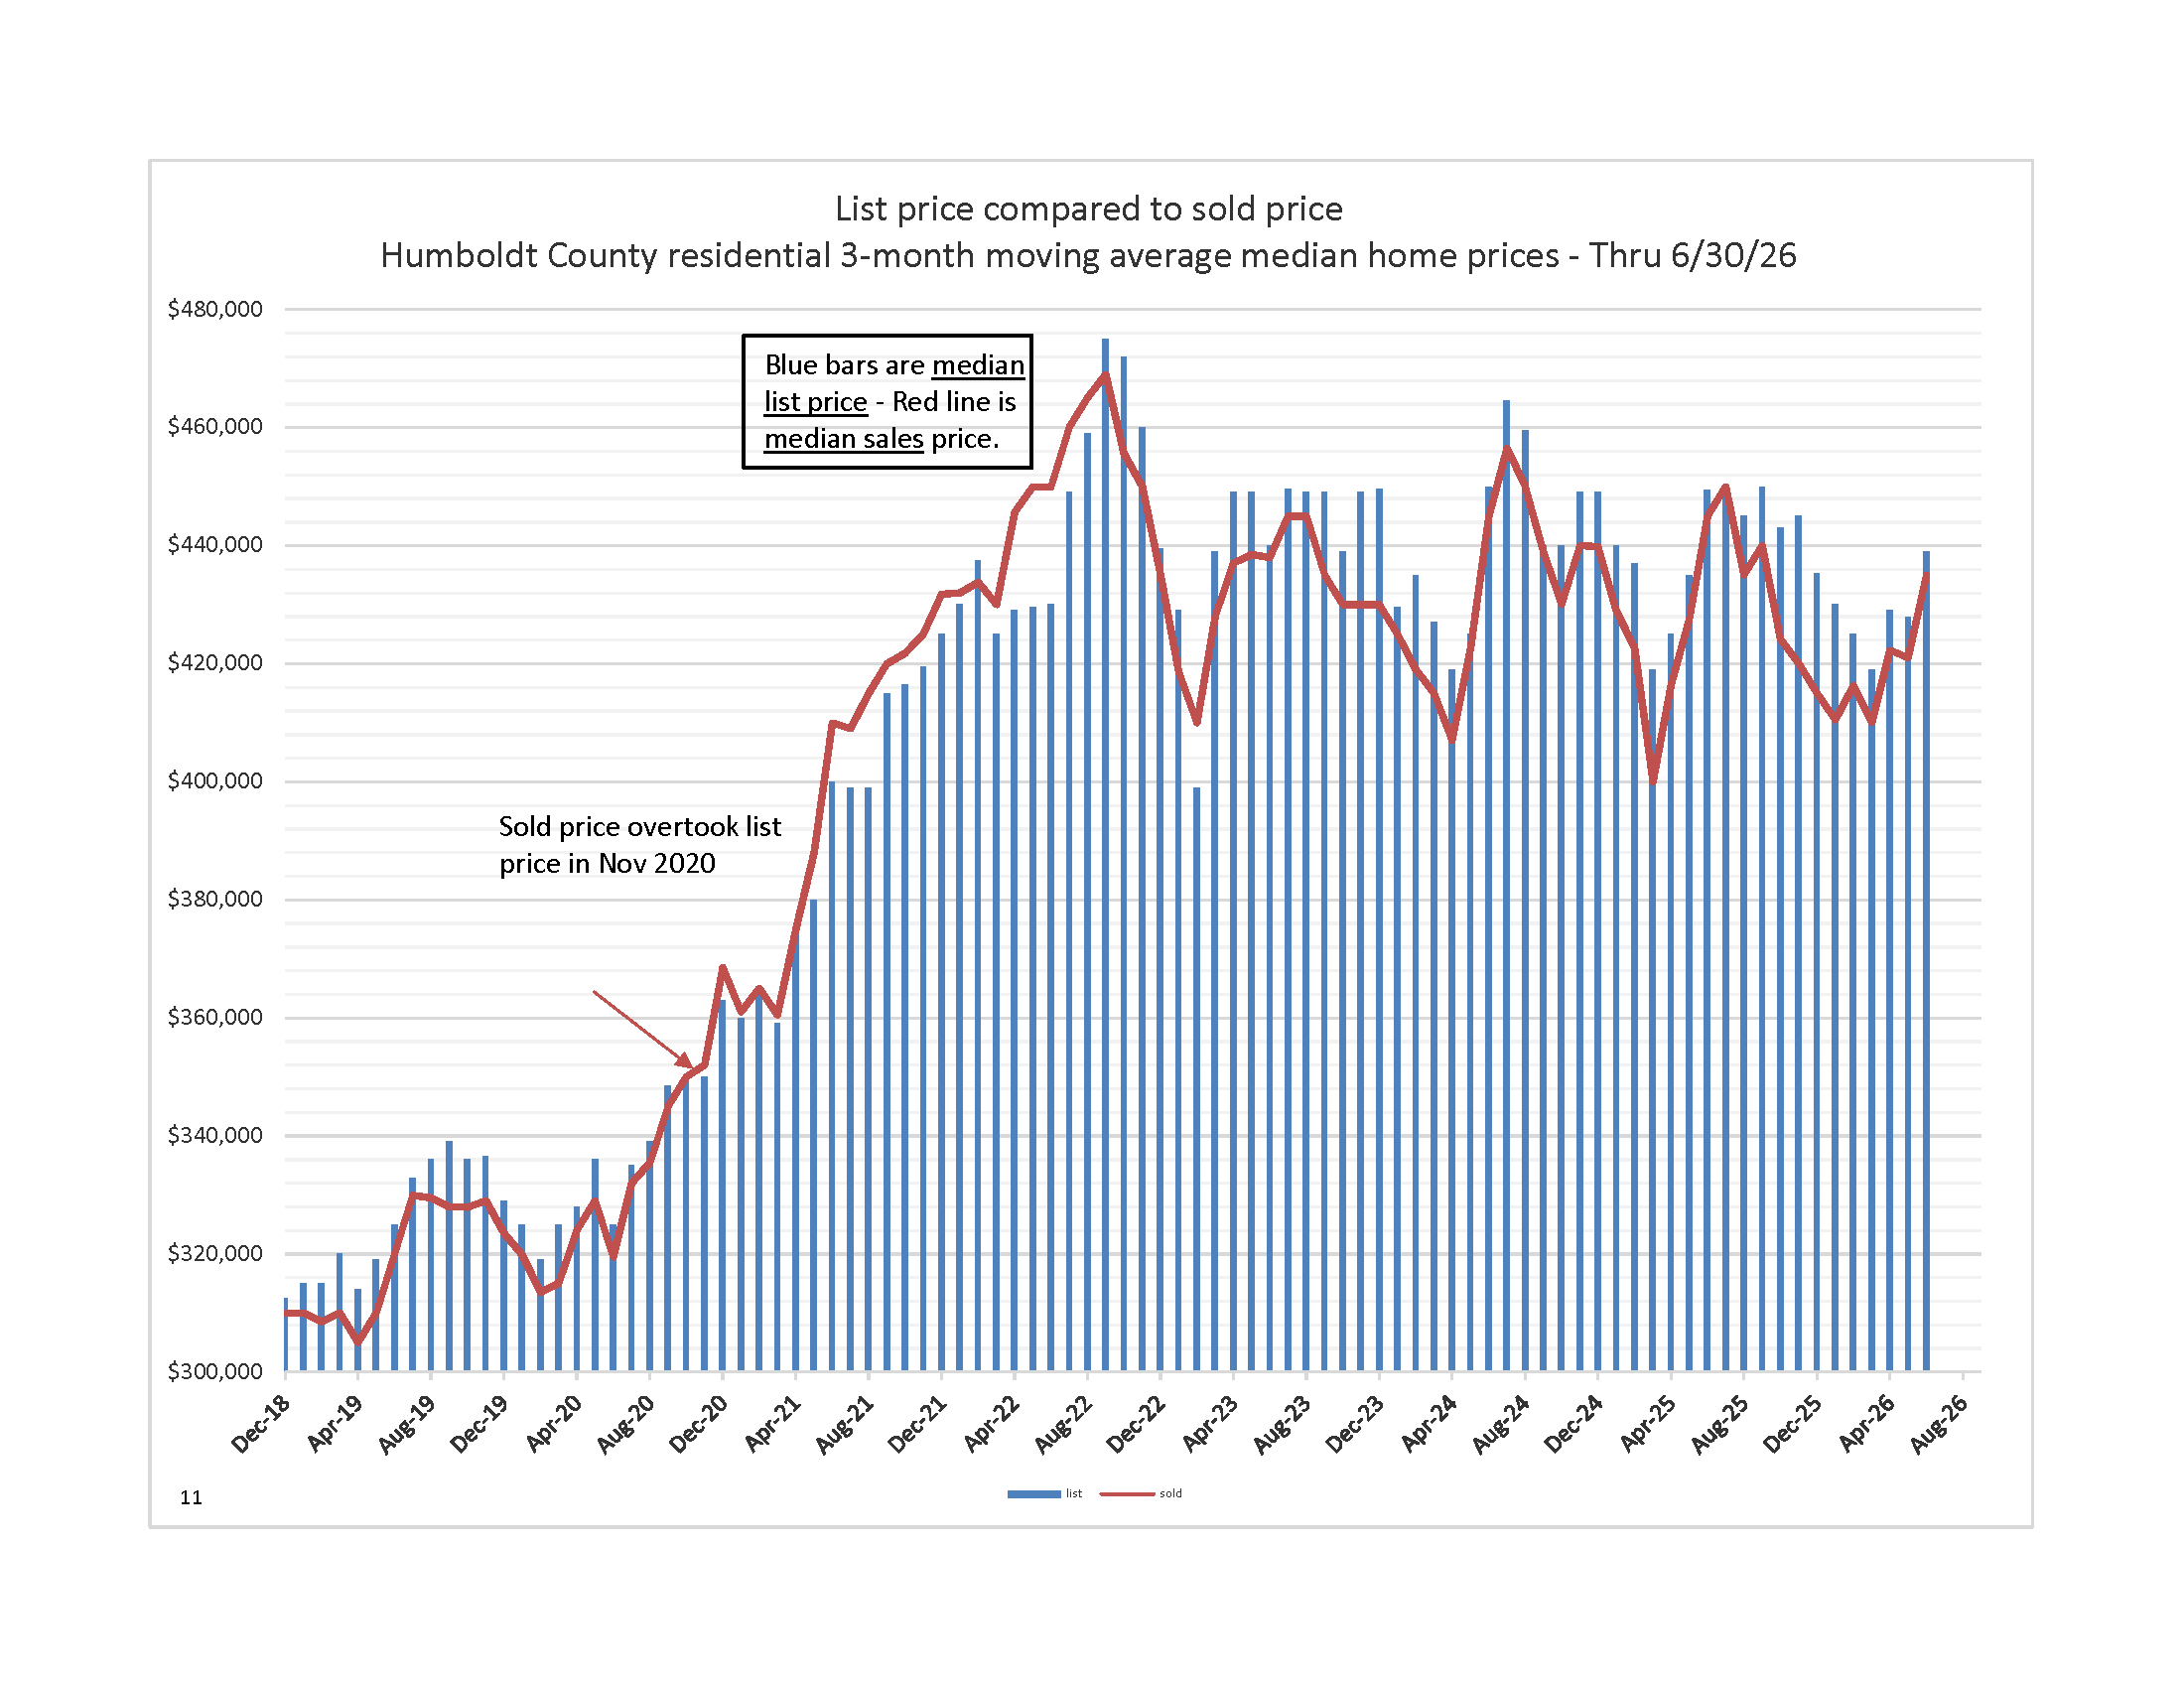
3-month median list price compared to 3-month median sold price
3-month median list price compared to 3-month median sold price. Last month, I wrote, “May was a bit abnormal in that both the 3-month list price and the sold price decreased.” The month of June was just the opposite. There was a healthy increase in both the 3-month list price and sales price. This behavior is more normal for this part of the buying season. The 3-month median list price rose from $427,500 to $439,000, and the 3-month median sales price rose from $421,000 to $435,000. Based on the previous four years, I would expect higher numbers next month before the normal annual decline sets in.
The monthly charts are updated through May 2026